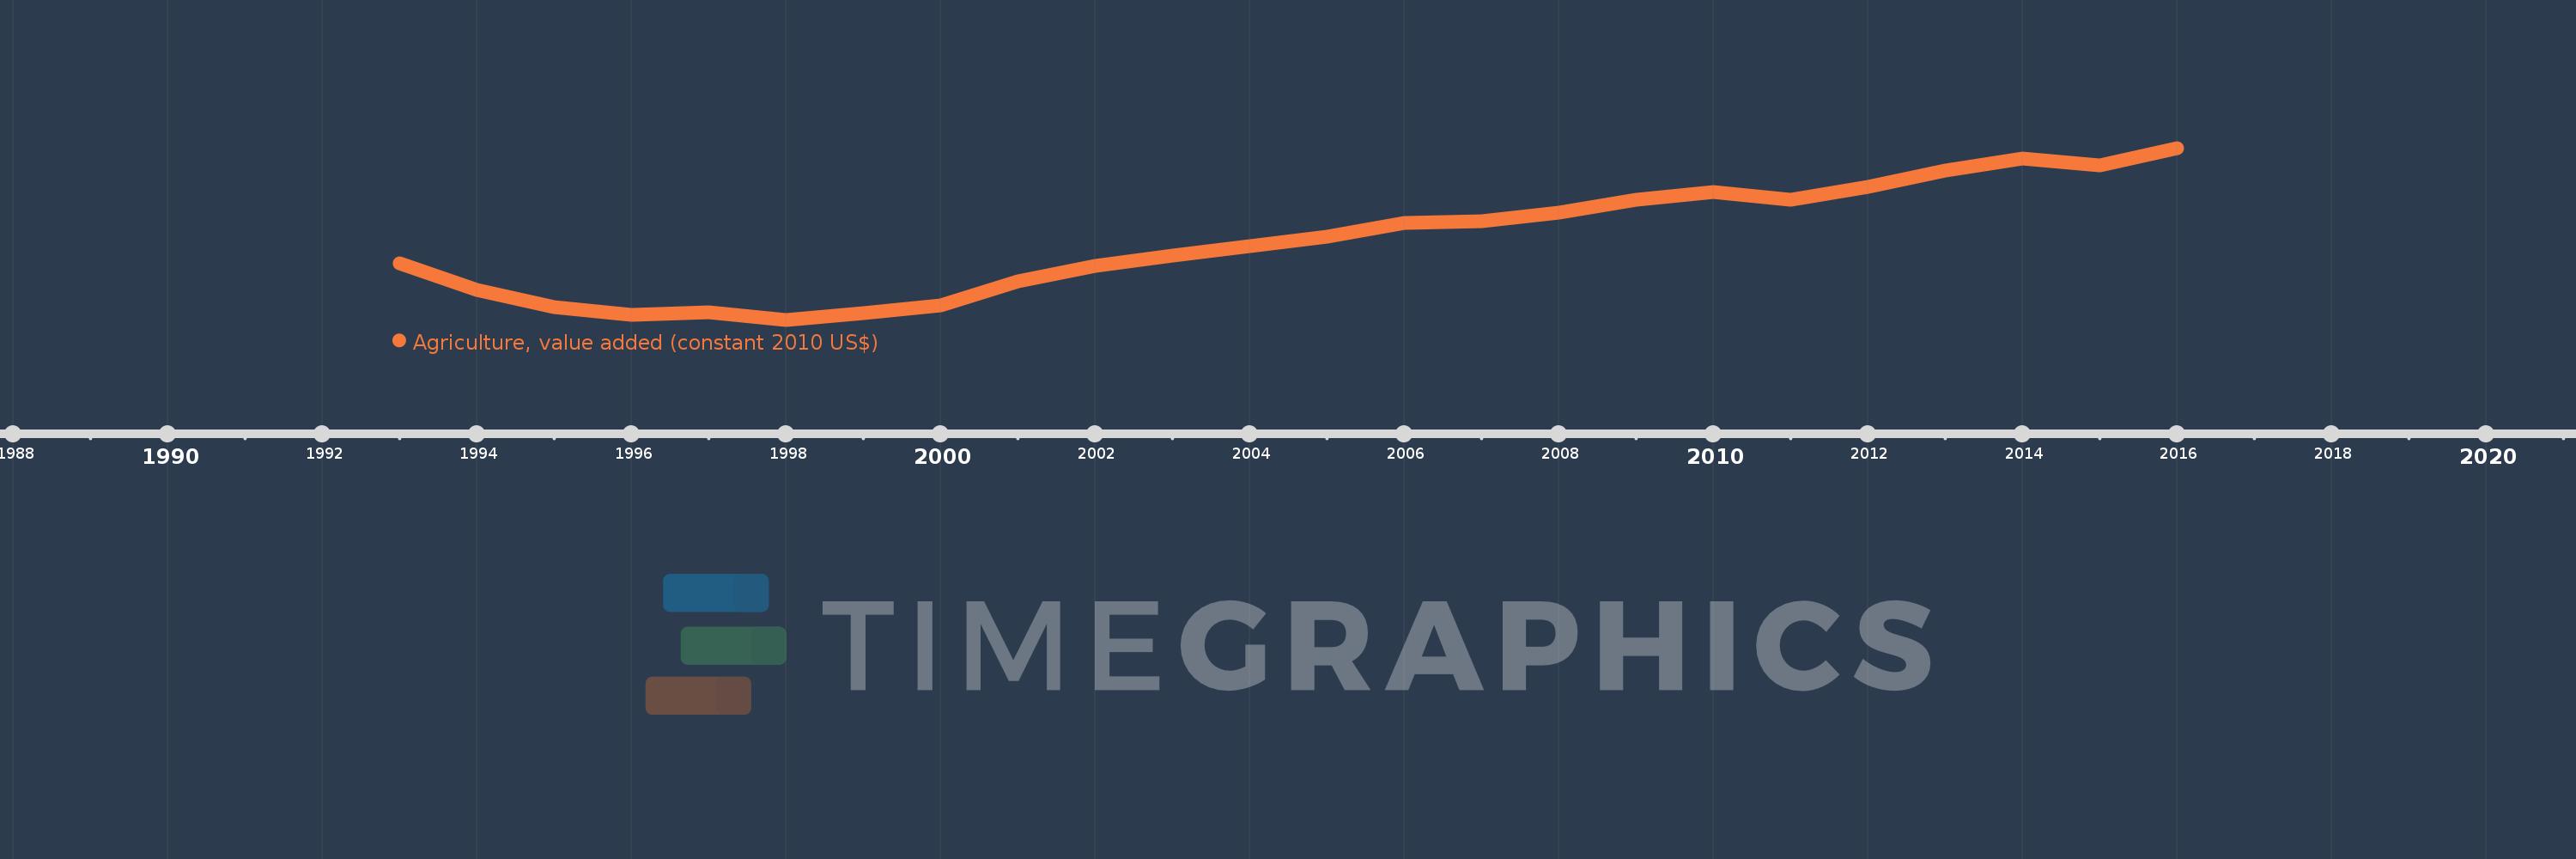
Cette échelle de temps montre un graphique de 1993 année à 2016 année Azerbaijan. Les données jusqu'à 1992 année ne sont pas présentés. Quantité d'observations actuelles selon dates: 24.
Source (désignation):
Les indicateurs du développement mondiale
Source (organisation):
World Bank national accounts data, and OECD National Accounts data files.
Catégories:
Economy & Growth
Dernière mise à jour
23 avr. 2017
Les indicateurs de changement de valeurs selon les années
En moyenne:
2.393 mds
Minimum:
1.372 mds
1 janv. 1998
Maximum:
3.603 mds
1 janv. 2016
Pour la date d''observation
Valeur
Changement absolu
Le changement par rapport à la valeur précédente
1 janv. 1993
2.108 mds
+2.108 mds
0.0%
1 janv. 1994
1.765 mds
-343.661 mln.
-16.3%
1 janv. 1995
1.539 mds
-225.88 mln.
-12.8%
1 janv. 1996
1.431 mds
-107.717 mln.
-7.0%
1 janv. 1997
1.474 mds
+42.933 mln.
3.0%
1 janv. 1998
1.372 mds
-101.708 mln.
-6.9%
1 janv. 1999
1.457 mds
+85.084 mln.
6.2%
1 janv. 2000
1.561 mds
+103.475 mln.
7.1%
1 janv. 2001
1.867 mds
+305.734 mln.
19.59%
1 janv. 2002
2.074 mds
+207.194 mln.
11.1%
1 janv. 2003
2.207 mds
+132.723 mln.
6.4%
1 janv. 2004
2.33 mds
+123.566 mln.
5.6%
1 janv. 2005
2.447 mds
+116.505 mln.
5.0%
1 janv. 2006
2.63 mds
+183.495 mln.
7.5%
1 janv. 2007
2.654 mds
+23.671 mln.
0.9%
1 janv. 2008
2.76 mds
+106.151 mln.
4.0%
1 janv. 2009
2.928 mds
+168.355 mln.
6.1%
1 janv. 2010
3.031 mds
+102.489 mln.
3.5%
1 janv. 2011
2.933 mds
-97.532 mln.
-3.22%
1 janv. 2012
3.103 mds
+170.127 mln.
5.8%
1 janv. 2013
3.308 mds
+204.821 mln.
6.6%
1 janv. 2014
3.47 mds
+162.101 mln.
4.9%
1 janv. 2015
3.38 mds
-90.227 mln.
-2.6%
1 janv. 2016
3.603 mds
+223.083 mln.
6.6%
Classement des pays selon les statistiques actuelles par années