33
/fr/
AIzaSyAYiBZKx7MnpbEhh9jyipgxe19OcubqV5w
August 1, 2025
181836
Luxembourg
LUX
true
2
1
Agriculture, value added (constant 2010 US$)
2016,2015,2014,2013,2012,2011,2010,2009,2008,2007,2006,2005,2004,2003,2002,2001,2000,1999,1998,1997,1996
Download
Bibliothèque de statistiques globales →Luxembourg →

Agriculture, value added (constant 2010 US$)

Cette statistique dans les autres pays:

AfghanistanAlbaniaAlgeriaAndorraAntigua and BarbudaArab WorldArgentinaArmeniaArubaAustraliaAustriaAzerbaijanBahamas, TheBahrainBangladeshBarbadosBelarusBelgiumBelizeBeninBermudaBhutanBoliviaBosnia and HerzegovinaBotswanaBrazilBrunei DarussalamBulgariaBurkina FasoBurundiCabo VerdeCambodiaCameroonCanadaCaribbean small statesCentral African RepublicCentral Europe and the BalticsChadChileChinaColombiaComorosCongo, Dem. Rep.Congo, Rep.Costa RicaCote d'IvoireCroatiaCubaCyprusCzech RepublicDenmarkDominicaDominican RepublicEarly-demographic dividendEast Asia & PacificEast Asia & Pacific (excluding high income)East Asia & Pacific (IDA & IBRD countries)EcuadorEgypt, Arab Rep.El SalvadorEquatorial GuineaEstoniaEthiopiaEuro areaEurope & Central AsiaEurope & Central Asia (excluding high income)Europe & Central Asia (IDA & IBRD countries)European UnionFijiFinlandFragile and conflict affected situationsFranceGabonGambia, TheGeorgiaGermanyGhanaGreeceGrenadaGuatemalaGuineaGuinea-BissauGuyanaHeavily indebted poor countries (HIPC)High incomeHondurasHong Kong SAR, ChinaHungaryIBRD onlyIcelandIDA & IBRD totalIDA blendIDA onlyIDA totalIndiaIndonesiaIran, Islamic Rep.IraqIrelandItalyJamaicaJapanJordanKazakhstanKenyaKiribatiKorea, Rep.KosovoKuwaitKyrgyz RepublicLao PDRLate-demographic dividendLatin America & Caribbean Latin America & Caribbean (excluding high income)Latin America & the Caribbean (IDA & IBRD countries)LatviaLeast developed countries: UN classificationLebanonLesothoLiberiaLithuaniaLow & middle incomeLow incomeLower middle incomeLuxembourgMacao SAR, ChinaMacedonia, FYRMadagascarMalawiMalaysiaMaldivesMaliMaltaMarshall IslandsMauritaniaMauritiusMexicoMicronesia, Fed. Sts.Middle East & North AfricaMiddle East & North Africa (excluding high income)Middle East & North Africa (IDA & IBRD countries)Middle incomeMoldovaMongoliaMontenegroMoroccoMozambiqueMyanmarNamibiaNepalNetherlandsNew ZealandNicaraguaNigerNigeriaNorth AmericaNorwayOECD membersOmanOther small statesPakistanPalauPanamaParaguayPeruPhilippinesPolandPortugalPost-demographic dividendPre-demographic dividendPuerto RicoQatarRomaniaRussian FederationRwandaSamoaSao Tome and PrincipeSaudi ArabiaSenegalSerbiaSeychellesSierra LeoneSingaporeSlovak RepublicSloveniaSmall statesSouth AfricaSouth AsiaSouth Asia (IDA & IBRD)SpainSri LankaSt. Kitts and NevisSt. LuciaSt. Vincent and the GrenadinesSub-Saharan Africa Sub-Saharan Africa (excluding high income)Sub-Saharan Africa (IDA & IBRD countries)SudanSurinameSwazilandSwedenSwitzerlandTajikistanTanzaniaThailandTimor-LesteTogoTongaTrinidad and TobagoTunisiaTurkeyTurkmenistanTuvaluUgandaUkraineUnited Arab EmiratesUnited KingdomUnited StatesUpper middle incomeUruguayUzbekistanVanuatuVenezuela, RBVietnamWest Bank and GazaWorldYemen, Rep.ZambiaZimbabwe

La ligne de temps

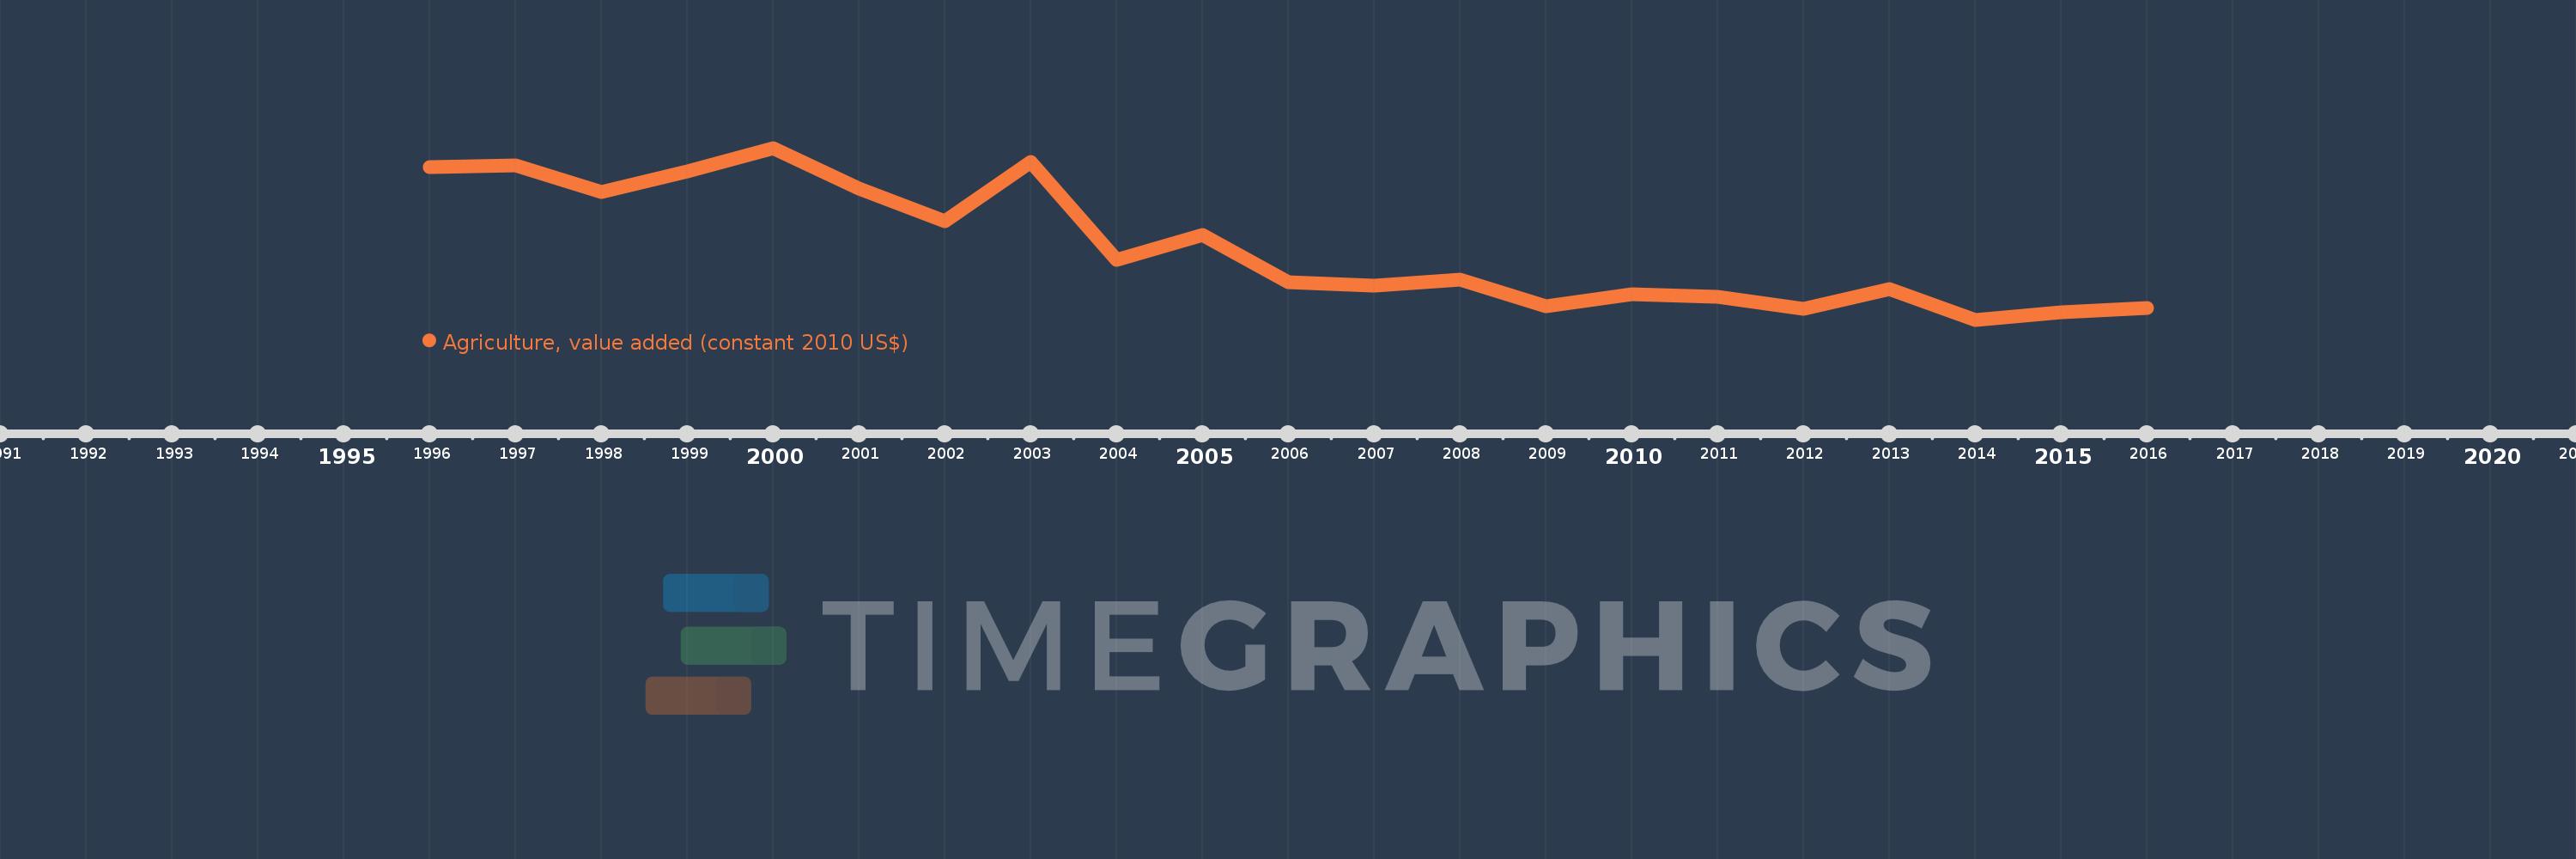
Cette échelle de temps montre un graphique de 1996 année à 2016 année Luxembourg. Les données jusqu'à 1995 année ne sont pas présentés. Quantité d'observations actuelles selon dates: 21.

Source (désignation):

Les indicateurs du développement mondiale

Source (organisation):

World Bank national accounts data, and OECD National Accounts data files.

Catégories:

Economy & Growth

Dernière mise à jour

23 avr. 2017

Les indicateurs de changement de valeurs selon les années

En moyenne:
214.892 mln.
Minimum:
93.377 mln.
1 janv. 2014
Maximum:
381.274 mln.
1 janv. 2000
Pour la date d''observation
Valeur
Changement absolu
Le changement par rapport à la valeur précédente
1 janv. 1996
349.758 mln.
+349.758 mln.
0.0%
1 janv. 1997
352.197 mln.
+2.44 mln.
0.7%
1 janv. 1998
306.811 mln.
-45.387 mln.
-12.89%
1 janv. 1999
342.453 mln.
+35.642 mln.
11.62%
1 janv. 2000
381.274 mln.
+38.821 mln.
11.34%
1 janv. 2001
313.343 mln.
-67.931 mln.
-17.82%
1 janv. 2002
257.881 mln.
-55.462 mln.
-17.7%
1 janv. 2003
358.013 mln.
+100.132 mln.
38.83%
1 janv. 2004
193.51 mln.
-164.503 mln.
-45.95%
1 janv. 2005
236.026 mln.
+42.517 mln.
21.97%
1 janv. 2006
156.821 mln.
-79.205 mln.
-33.56%
1 janv. 2007
150.464 mln.
-6.358 mln.
-4.05%
1 janv. 2008
160.0 mln.
+9.536 mln.
6.34%
1 janv. 2009
116.026 mln.
-43.974 mln.
-27.48%
1 janv. 2010
136.821 mln.
+20.795 mln.
17.92%
1 janv. 2011
132.45 mln.
-4.371 mln.
-3.19%
1 janv. 2012
111.523 mln.
-20.927 mln.
-15.8%
1 janv. 2013
144.238 mln.
+32.715 mln.
29.33%
1 janv. 2014
93.377 mln.
-50.861 mln.
-35.26%
1 janv. 2015
105.96 mln.
+12.583 mln.
13.48%
1 janv. 2016
113.775 mln.
+7.815 mln.
7.38%

Classement des pays selon les statistiques actuelles par années