30
/fr/
AIzaSyAYiBZKx7MnpbEhh9jyipgxe19OcubqV5w
April 1, 2024
61890
Upper middle income
UMC
false
2
1
Net bilateral aid flows from DAC donors, Slovak Republic (current US$)
2015,2014,2013,2012,2011,2010,2009,2008,2007,2006
Download
Bibliothèque de statistiques globales →Upper middle income →

Net bilateral aid flows from DAC donors, Slovak Republic (current US$)

Cette statistique dans les autres pays:

AfghanistanAlbaniaAngolaArab WorldArmeniaAzerbaijanBangladeshBelarusBeninBosnia and HerzegovinaBrazilBurundiCambodiaCentral Europe and the BalticsChileChinaColombiaCosta RicaCroatiaCubaEast Asia & PacificEast Asia & Pacific (excluding high income)East Asia & Pacific (IDA & IBRD countries)EcuadorEgypt, Arab Rep.EthiopiaEurope & Central AsiaEurope & Central Asia (excluding high income)Europe & Central Asia (IDA & IBRD countries)European UnionFragile and conflict affected situationsGambia, TheGeorgiaHaitiHeavily indebted poor countries (HIPC)High incomeIBRD onlyIDA & IBRD totalIDA blendIDA onlyIDA totalIndiaIndonesiaIraqJordanKazakhstanKenyaKosovoKyrgyz RepublicLao PDRLatin America & Caribbean Latin America & Caribbean (excluding high income)Latin America & the Caribbean (IDA & IBRD countries)Least developed countries: UN classificationLebanonLesothoLiberiaLibyaLow & middle incomeLow incomeLower middle incomeMacedonia, FYRMadagascarMaliMexicoMiddle East & North AfricaMiddle East & North Africa (excluding high income)Middle East & North Africa (IDA & IBRD countries)Middle incomeMoldovaMongoliaMontenegroMozambiqueMyanmarNamibiaNepalNicaraguaOECD membersOther small statesPakistanParaguayPeruPhilippinesRwandaSerbiaSmall statesSouth AsiaSouth Asia (IDA & IBRD)South SudanSub-Saharan Africa Sub-Saharan Africa (excluding high income)Sub-Saharan Africa (IDA & IBRD countries)SudanSyrian Arab RepublicTajikistanTanzaniaThailandTunisiaTurkeyUgandaUkraineUpper middle incomeUzbekistanVietnamWest Bank and GazaWorldYemen, Rep.

La ligne de temps

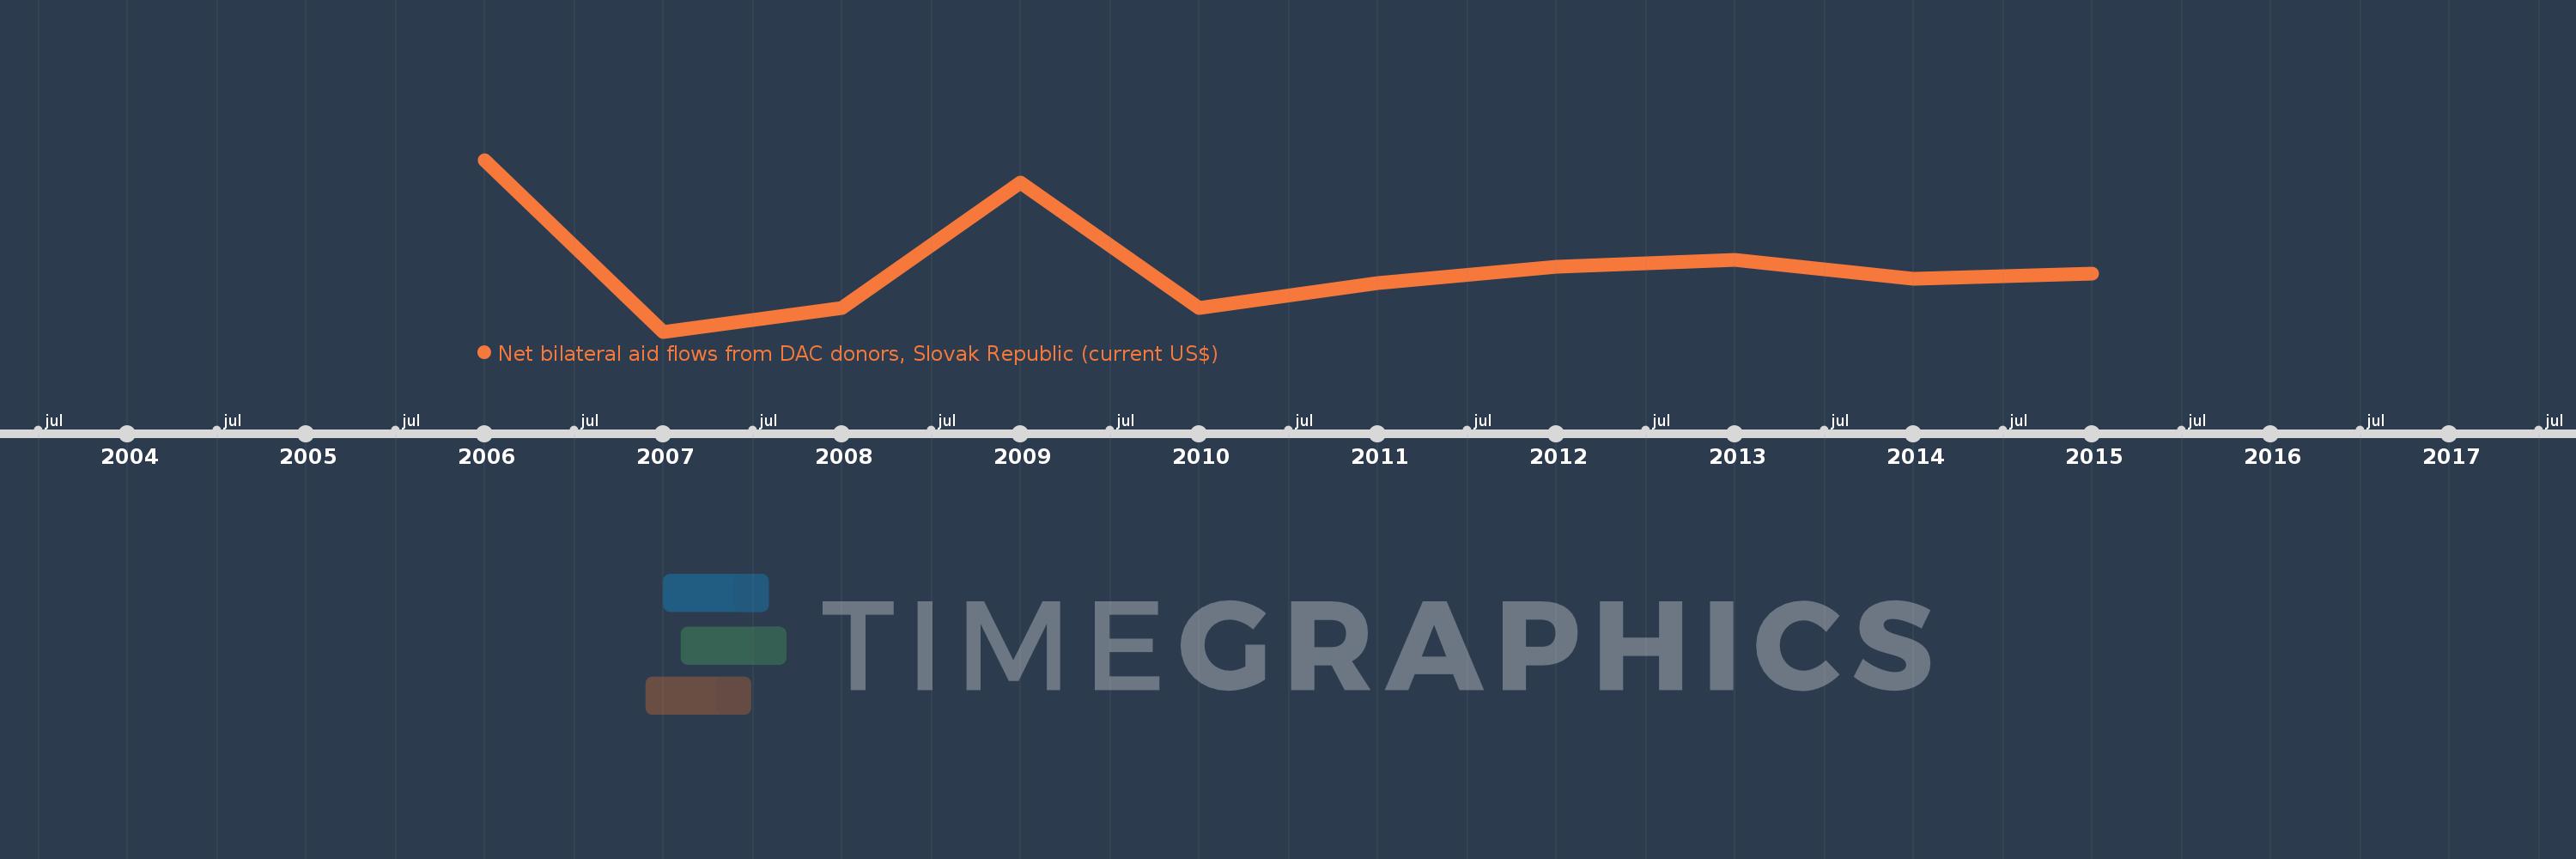
Cette échelle de temps montre un graphique de 2006 année à 2015 année Upper middle income. Les données jusqu'à 2005 année ne sont pas présentés. Quantité d'observations actuelles selon dates: 10.

Source (désignation):

Les indicateurs du développement mondiale

Source (organisation):

Development Assistance Committee of the Organisation for Economic Co-operation and Development, Geographical Distribution of Financial Flows to Developing Countries, Development Co-operation Report, and International Development Statistics database. Data are available online at: www.oecd.org/dac/stats/idsonline.

Catégories:

Aid Effectiveness

Dernière mise à jour

23 avr. 2017

Les indicateurs de changement de valeurs selon les années

En moyenne:
3.712 mln.
Minimum:
1.51 mln.
1 janv. 2007
Maximum:
7.21 mln.
1 janv. 2006
Pour la date d''observation
Valeur
Changement absolu
Le changement par rapport à la valeur précédente
1 janv. 2006
7.21 mln.
+7.21 mln.
0.0%
1 janv. 2007
1.51 mln.
-5.7 mln.
-79.06%
1 janv. 2008
2.3 mln.
+790.0 milles
52.32%
1 janv. 2009
6.46 mln.
+4.16 mln.
180.87%
1 janv. 2010
2.29 mln.
-4.17 mln.
-64.55%
1 janv. 2011
3.13 mln.
+840.0 milles
36.68%
1 janv. 2012
3.65 mln.
+520.0 milles
16.61%
1 janv. 2013
3.88 mln.
+230.0 milles
6.3%
1 janv. 2014
3.27 mln.
-610.0 milles
-15.72%
1 janv. 2015
3.42 mln.
+150.0 milles
4.59%

Classement des pays selon les statistiques actuelles par années