30
/fr/
AIzaSyAYiBZKx7MnpbEhh9jyipgxe19OcubqV5w
April 1, 2024
237455
Serbia
SRB
true
2
1
Net bilateral aid flows from DAC donors, Slovak Republic (current US$)
2015,2014,2013,2012,2011,2010,2009,2008,2007,2006
Download
Bibliothèque de statistiques globales →Serbia →

Net bilateral aid flows from DAC donors, Slovak Republic (current US$)

Cette statistique dans les autres pays:

AfghanistanAlbaniaAngolaArab WorldArmeniaAzerbaijanBangladeshBelarusBeninBosnia and HerzegovinaBrazilBurundiCambodiaCentral Europe and the BalticsChileChinaColombiaCosta RicaCroatiaCubaEast Asia & PacificEast Asia & Pacific (excluding high income)East Asia & Pacific (IDA & IBRD countries)EcuadorEgypt, Arab Rep.EthiopiaEurope & Central AsiaEurope & Central Asia (excluding high income)Europe & Central Asia (IDA & IBRD countries)European UnionFragile and conflict affected situationsGambia, TheGeorgiaHaitiHeavily indebted poor countries (HIPC)High incomeIBRD onlyIDA & IBRD totalIDA blendIDA onlyIDA totalIndiaIndonesiaIraqJordanKazakhstanKenyaKosovoKyrgyz RepublicLao PDRLatin America & Caribbean Latin America & Caribbean (excluding high income)Latin America & the Caribbean (IDA & IBRD countries)Least developed countries: UN classificationLebanonLesothoLiberiaLibyaLow & middle incomeLow incomeLower middle incomeMacedonia, FYRMadagascarMaliMexicoMiddle East & North AfricaMiddle East & North Africa (excluding high income)Middle East & North Africa (IDA & IBRD countries)Middle incomeMoldovaMongoliaMontenegroMozambiqueMyanmarNamibiaNepalNicaraguaOECD membersOther small statesPakistanParaguayPeruPhilippinesRwandaSerbiaSmall statesSouth AsiaSouth Asia (IDA & IBRD)South SudanSub-Saharan Africa Sub-Saharan Africa (excluding high income)Sub-Saharan Africa (IDA & IBRD countries)SudanSyrian Arab RepublicTajikistanTanzaniaThailandTunisiaTurkeyUgandaUkraineUpper middle incomeUzbekistanVietnamWest Bank and GazaWorldYemen, Rep.

La ligne de temps

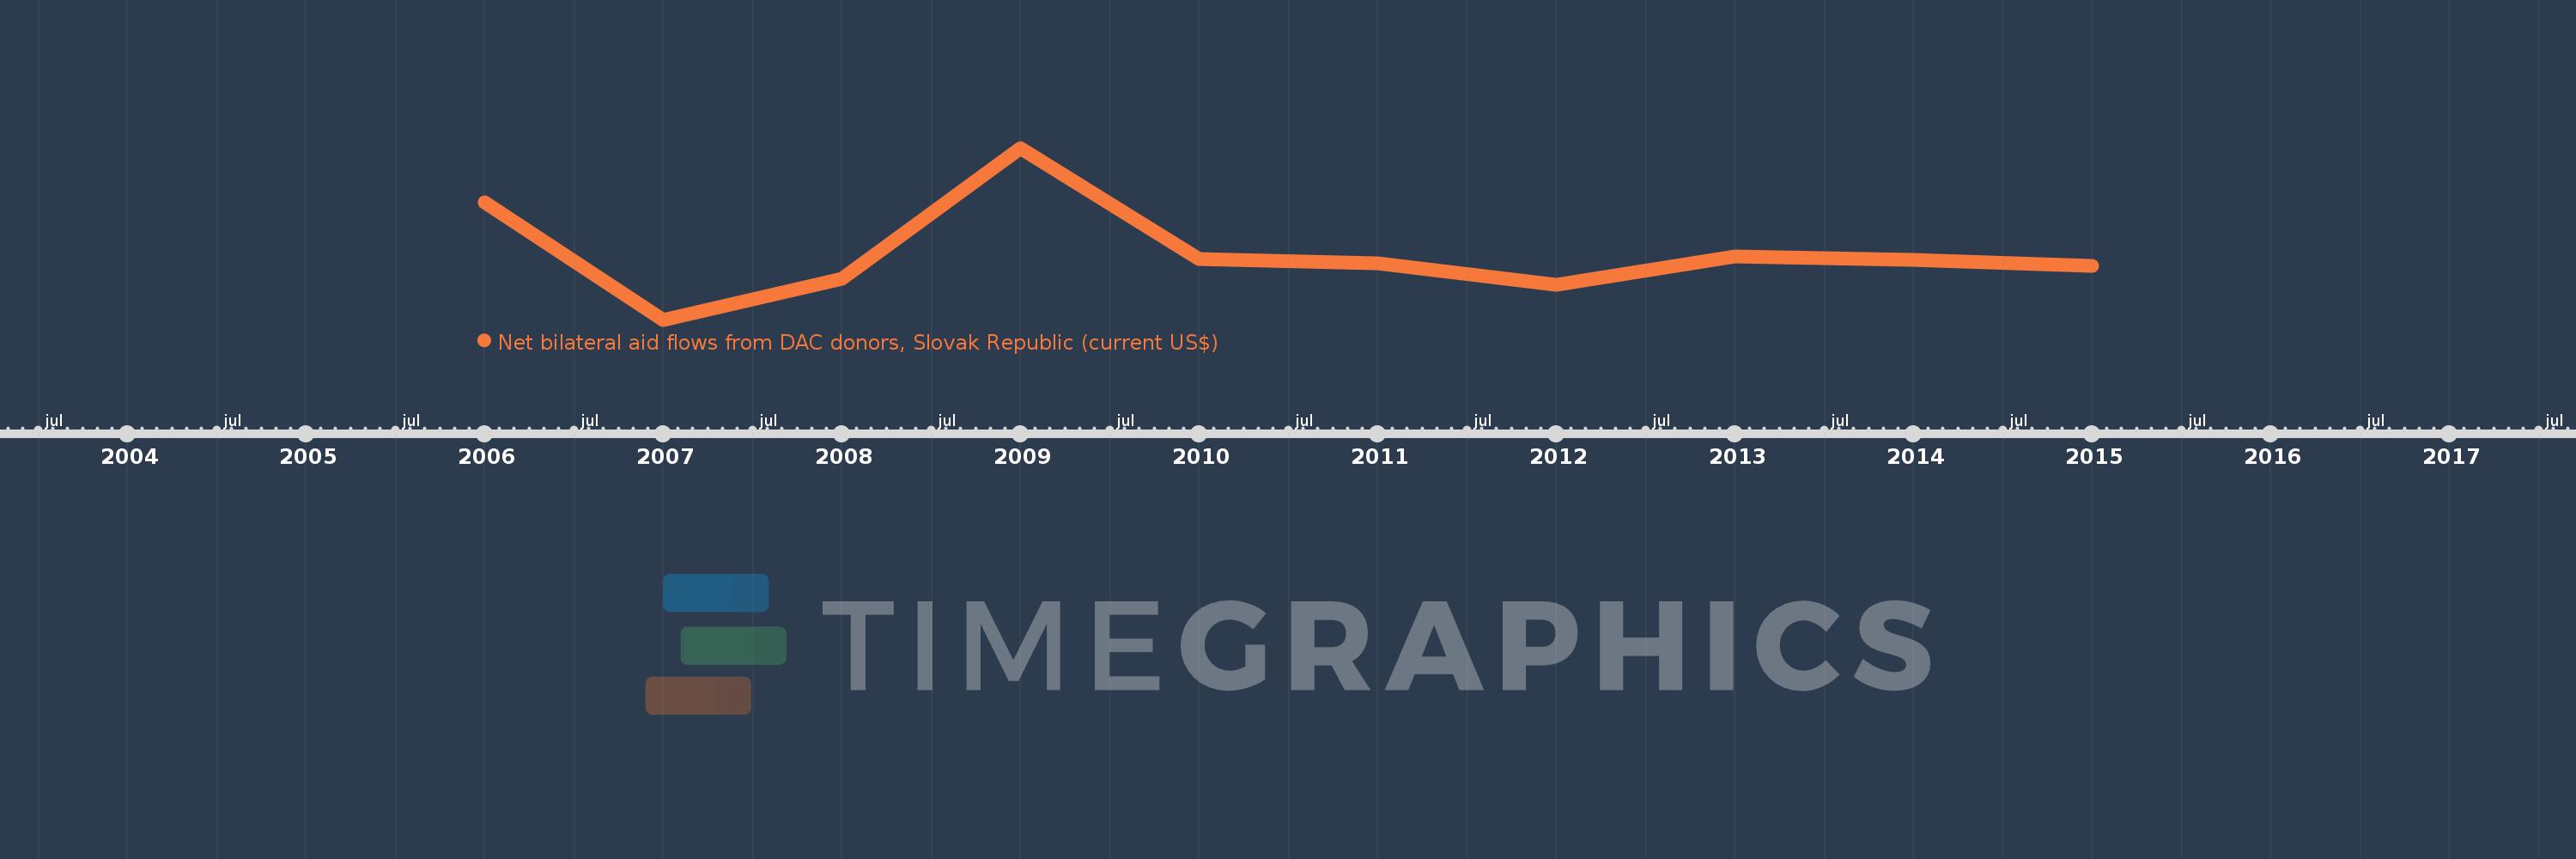
Cette échelle de temps montre un graphique de 2006 année à 2015 année Serbia. Les données jusqu'à 2005 année ne sont pas présentés. Quantité d'observations actuelles selon dates: 10.

Source (désignation):

Les indicateurs du développement mondiale

Source (organisation):

Development Assistance Committee of the Organisation for Economic Co-operation and Development, Geographical Distribution of Financial Flows to Developing Countries, Development Co-operation Report, and International Development Statistics database. Data are available online at: www.oecd.org/dac/stats/idsonline.

Catégories:

Aid Effectiveness

Dernière mise à jour

23 avr. 2017

Les indicateurs de changement de valeurs selon les années

En moyenne:
1.486 mln.
Minimum:
510.0 milles
1 janv. 2007
Maximum:
3.05 mln.
1 janv. 2009
Pour la date d''observation
Valeur
Changement absolu
Le changement par rapport à la valeur précédente
1 janv. 2006
2.24 mln.
+2.24 mln.
0.0%
1 janv. 2007
510.0 milles
-1.73 mln.
-77.23%
1 janv. 2008
1.12 mln.
+610.0 milles
119.61%
1 janv. 2009
3.05 mln.
+1.93 mln.
172.32%
1 janv. 2010
1.41 mln.
-1.64 mln.
-53.77%
1 janv. 2011
1.35 mln.
-60.0 milles
-4.26%
1 janv. 2012
1.03 mln.
-320.0 milles
-23.7%
1 janv. 2013
1.45 mln.
+420.0 milles
40.78%
1 janv. 2014
1.39 mln.
-60.0 milles
-4.14%
1 janv. 2015
1.31 mln.
-80.0 milles
-5.76%

Classement des pays selon les statistiques actuelles par années