Download Cette statistique dans les autres pays:
La ligne de temps
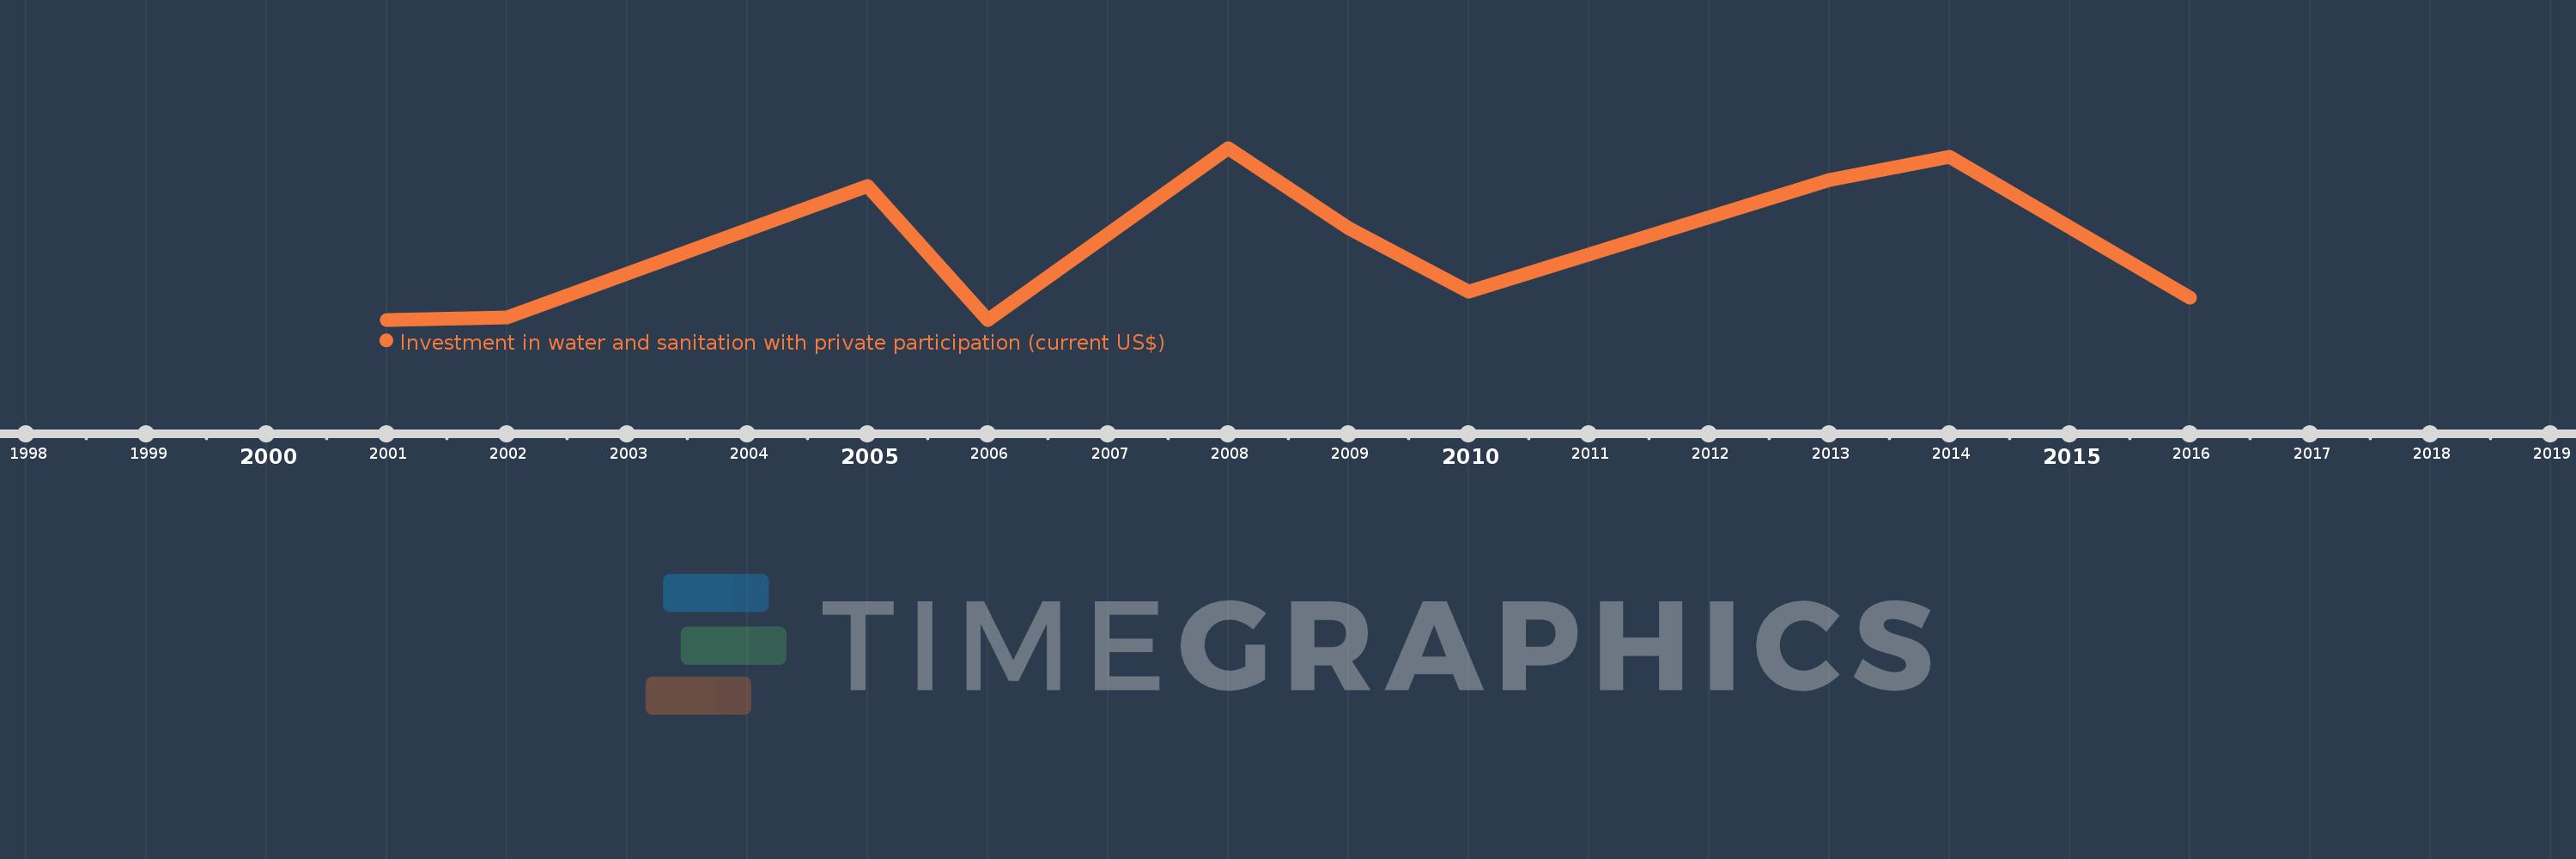
Cette échelle de temps montre un graphique de 2001 année à 2016 année South Asia (IDA & IBRD). Les données jusqu'à 2000 année ne sont pas présentés. Quantité d'observations actuelles selon dates: 10.
Source (désignation):
Les indicateurs du développement mondiale
Source (organisation):
World Bank, Private Participation in Infrastructure Project Database (http://ppi.worldbank.org).
Catégories:
Infrastructure, Private Sector
Dernière mise à jour
23 avr. 2017
Les indicateurs de changement de valeurs selon les années
Maximum:
142.25 mln.
1 janv. 2008
Pour la date d''observation
Valeur
Changement absolu
Le changement par rapport à la valeur précédente
1 janv. 2002
2.1 mln.
+2.1 mln.
%
1 janv. 2005
110.75 mln.
+108.65 mln.
5.17 milles%
1 janv. 2006
0.0
-110.75 mln.
-100.0%
1 janv. 2008
142.25 mln.
+142.25 mln.
%
1 janv. 2009
75.9 mln.
-66.35 mln.
-46.64%
1 janv. 2010
23.53 mln.
-52.37 mln.
-69.0%
1 janv. 2013
115.6 mln.
+92.07 mln.
391.29%
1 janv. 2014
135.1 mln.
+19.5 mln.
16.87%
1 janv. 2016
18.5 mln.
-116.6 mln.
-86.31%
Classement des pays selon les statistiques actuelles par années