Download Cette statistique dans les autres pays:
La ligne de temps
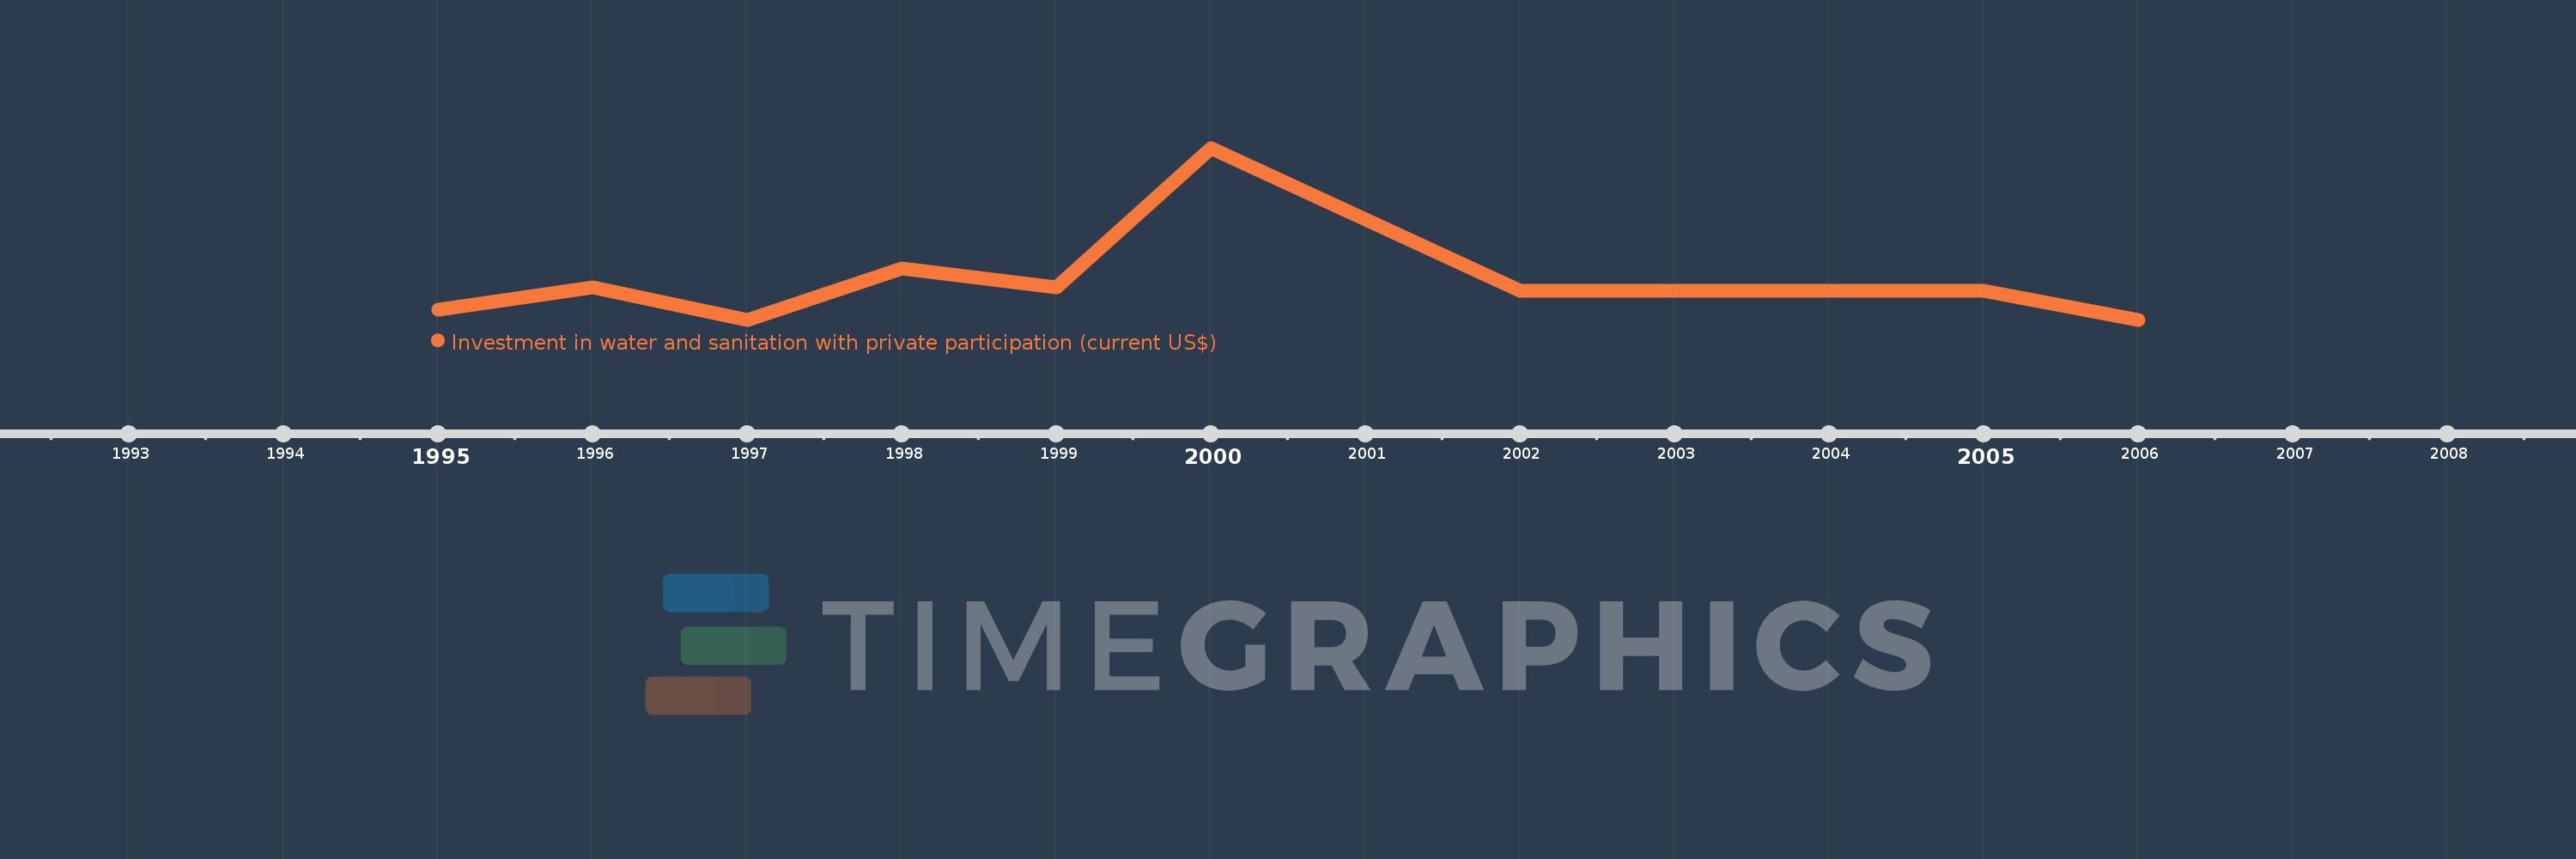
Cette échelle de temps montre un graphique de 1995 année à 2006 année Latin America & Caribbean . Les données jusqu'à 1994 année ne sont pas présentés. Quantité d'observations actuelles selon dates: 9.
Source (désignation):
Les indicateurs du développement mondiale
Source (organisation):
World Bank, Private Participation in Infrastructure Project Database (http://ppi.worldbank.org).
Catégories:
Infrastructure, Private Sector
Dernière mise à jour
23 avr. 2017
Les indicateurs de changement de valeurs selon les années
Minimum:
191.444 mln.
1 janv. 2006
Maximum:
6.011 mds
1 janv. 2000
Pour la date d''observation
Valeur
Changement absolu
Le changement par rapport à la valeur précédente
1 janv. 1995
525.2 mln.
+525.2 mln.
0.0%
1 janv. 1996
1.293 mds
+768.1 mln.
146.25%
1 janv. 1997
192.3 mln.
-1.101 mds
-85.13%
1 janv. 1998
1.933 mds
+1.741 mds
905.3%
1 janv. 1999
1.276 mds
-657.3 mln.
-34.0%
1 janv. 2000
6.011 mds
+4.735 mds
371.09%
1 janv. 2002
1.177 mds
-4.833 mds
-80.41%
1 janv. 2005
1.162 mds
-15.35 mln.
-1.3%
1 janv. 2006
191.444 mln.
-970.636 mln.
-83.53%
Classement des pays selon les statistiques actuelles par années