33
/fr/
AIzaSyAYiBZKx7MnpbEhh9jyipgxe19OcubqV5w
August 1, 2025
53237
Other small states
OSS
false
2
1
Bank nonperforming loans to total gross loans (%)
2016,2015,2014,2013,2012,2011,2010,2009,2007,2006,2005,2004,2003,2002
Download
Bibliothèque de statistiques globales →Other small states →

Bank nonperforming loans to total gross loans (%)

Cette statistique dans les autres pays:

AfghanistanAlbaniaAlgeriaAngolaArab WorldArgentinaArmeniaAustraliaAustriaAzerbaijanBahamas, TheBahrainBangladeshBelarusBelgiumBhutanBoliviaBosnia and HerzegovinaBotswanaBrazilBrunei DarussalamBulgariaBurundiCambodiaCameroonCanadaCaribbean small statesCentral Europe and the BalticsChileChinaColombiaComorosCongo, Rep.Costa RicaCroatiaCyprusCzech RepublicDenmarkDjiboutiDominican RepublicEarly-demographic dividendEast Asia & PacificEast Asia & Pacific (excluding high income)East Asia & Pacific (IDA & IBRD countries)EcuadorEgypt, Arab Rep.El SalvadorEstoniaEthiopiaEuro areaEurope & Central AsiaEurope & Central Asia (excluding high income)Europe & Central Asia (IDA & IBRD countries)European UnionFijiFinlandFranceGabonGeorgiaGermanyGhanaGreeceGrenadaGuatemalaGuineaHigh incomeHondurasHong Kong SAR, ChinaHungaryIBRD onlyIcelandIDA & IBRD totalIDA blendIDA totalIndiaIndonesiaIrelandIsraelItalyJamaicaJapanJordanKazakhstanKenyaKorea, Rep.KosovoKuwaitKyrgyz RepublicLate-demographic dividendLatin America & Caribbean Latin America & Caribbean (excluding high income)Latin America & the Caribbean (IDA & IBRD countries)LatviaLebanonLesothoLithuaniaLow & middle incomeLower middle incomeLuxembourgMacao SAR, ChinaMacedonia, FYRMadagascarMalaysiaMaldivesMaltaMauritaniaMauritiusMexicoMiddle East & North AfricaMiddle East & North Africa (excluding high income)Middle East & North Africa (IDA & IBRD countries)Middle incomeMoldovaMontenegroMoroccoMozambiqueNamibiaNetherlandsNew ZealandNicaraguaNigeriaNorth AmericaNorwayOECD membersOmanOther small statesPakistanPanamaParaguayPeruPhilippinesPolandPortugalPost-demographic dividendQatarRomaniaRussian FederationRwandaSamoaSan MarinoSaudi ArabiaSenegalSerbiaSeychellesSierra LeoneSingaporeSlovak RepublicSloveniaSmall statesSolomon IslandsSouth AfricaSouth AsiaSouth Asia (IDA & IBRD)SpainSri LankaSt. Vincent and the GrenadinesSub-Saharan Africa Sub-Saharan Africa (excluding high income)Sub-Saharan Africa (IDA & IBRD countries)SudanSwazilandSwedenSwitzerlandTajikistanTanzaniaThailandTongaTrinidad and TobagoTunisiaTurkeyTurkmenistanUgandaUkraineUnited Arab EmiratesUnited KingdomUnited StatesUpper middle incomeUruguayUzbekistanVanuatuVenezuela, RBVietnamWest Bank and GazaWorldYemen, Rep.ZambiaZimbabwe

La ligne de temps

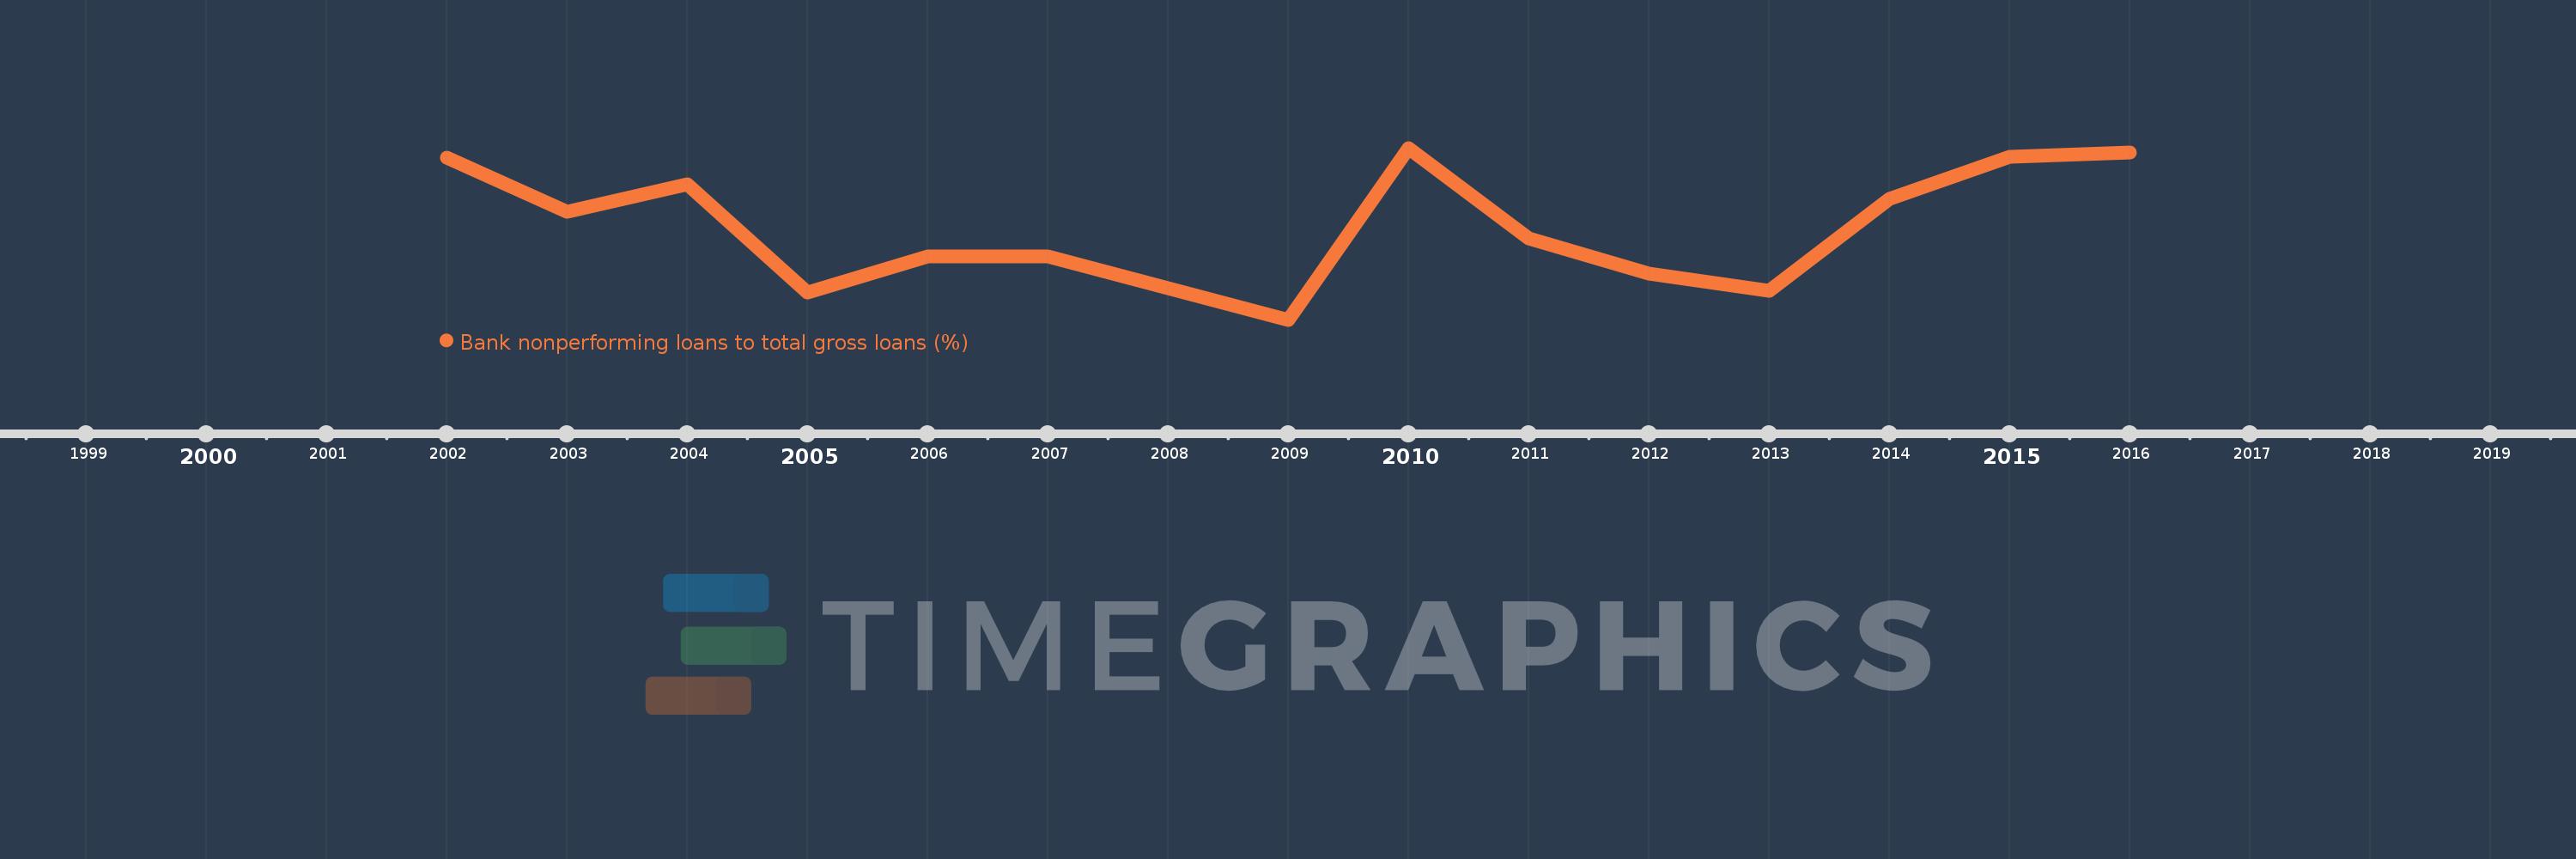
Cette échelle de temps montre un graphique de 2002 année à 2016 année Other small states. Les données jusqu'à 2001 année ne sont pas présentés. Quantité d'observations actuelles selon dates: 14.

Source (désignation):

Les indicateurs du développement mondiale

Source (organisation):

International Monetary Fund, Global Financial Stability Report.

Catégories:

Financial Sector

Dernière mise à jour

23 avr. 2017

Les indicateurs de changement de valeurs selon les années

En moyenne:
3.359
Minimum:
2.3
1 janv. 2009
Maximum:
4.205
1 janv. 2010
Pour la date d''observation
Valeur
Changement absolu
Le changement par rapport à la valeur précédente
1 janv. 2002
4.1
+4.1
0.0%
1 janv. 2003
3.5
-0.6
-14.63%
1 janv. 2004
3.8
+0.3
8.57%
1 janv. 2005
2.6
-1.2
-31.58%
1 janv. 2006
3.0
+0.4
15.38%
1 janv. 2007
3.0
0.0
0.0%
1 janv. 2009
2.3
-0.7
-23.33%
1 janv. 2010
4.205
+1.905
82.81%
1 janv. 2011
3.2
-1.005
-23.89%
1 janv. 2012
2.808
-0.392
-12.26%
1 janv. 2013
2.622
-0.186
-6.62%
1 janv. 2014
3.638
+1.016
38.77%
1 janv. 2015
4.104
+0.466
12.81%
1 janv. 2016
4.154
+0.05
1.22%

Classement des pays selon les statistiques actuelles par années