33
/fr/
AIzaSyAYiBZKx7MnpbEhh9jyipgxe19OcubqV5w
August 1, 2025
52429
OECD members
OED
false
2
1
Bank nonperforming loans to total gross loans (%)
2017,2016,2015,2014,2013,2012,2011,2010,2009,2008,2007,2006,2005,2004,2003,2002,2001,2000,1999,1998
Download
Bibliothèque de statistiques globales →OECD members →

Bank nonperforming loans to total gross loans (%)

Cette statistique dans les autres pays:

AfghanistanAlbaniaAlgeriaAngolaArab WorldArgentinaArmeniaAustraliaAustriaAzerbaijanBahamas, TheBahrainBangladeshBelarusBelgiumBhutanBoliviaBosnia and HerzegovinaBotswanaBrazilBrunei DarussalamBulgariaBurundiCambodiaCameroonCanadaCaribbean small statesCentral Europe and the BalticsChileChinaColombiaComorosCongo, Rep.Costa RicaCroatiaCyprusCzech RepublicDenmarkDjiboutiDominican RepublicEarly-demographic dividendEast Asia & PacificEast Asia & Pacific (excluding high income)East Asia & Pacific (IDA & IBRD countries)EcuadorEgypt, Arab Rep.El SalvadorEstoniaEthiopiaEuro areaEurope & Central AsiaEurope & Central Asia (excluding high income)Europe & Central Asia (IDA & IBRD countries)European UnionFijiFinlandFranceGabonGeorgiaGermanyGhanaGreeceGrenadaGuatemalaGuineaHigh incomeHondurasHong Kong SAR, ChinaHungaryIBRD onlyIcelandIDA & IBRD totalIDA blendIDA totalIndiaIndonesiaIrelandIsraelItalyJamaicaJapanJordanKazakhstanKenyaKorea, Rep.KosovoKuwaitKyrgyz RepublicLate-demographic dividendLatin America & Caribbean Latin America & Caribbean (excluding high income)Latin America & the Caribbean (IDA & IBRD countries)LatviaLebanonLesothoLithuaniaLow & middle incomeLower middle incomeLuxembourgMacao SAR, ChinaMacedonia, FYRMadagascarMalaysiaMaldivesMaltaMauritaniaMauritiusMexicoMiddle East & North AfricaMiddle East & North Africa (excluding high income)Middle East & North Africa (IDA & IBRD countries)Middle incomeMoldovaMontenegroMoroccoMozambiqueNamibiaNetherlandsNew ZealandNicaraguaNigeriaNorth AmericaNorwayOECD membersOmanOther small statesPakistanPanamaParaguayPeruPhilippinesPolandPortugalPost-demographic dividendQatarRomaniaRussian FederationRwandaSamoaSan MarinoSaudi ArabiaSenegalSerbiaSeychellesSierra LeoneSingaporeSlovak RepublicSloveniaSmall statesSolomon IslandsSouth AfricaSouth AsiaSouth Asia (IDA & IBRD)SpainSri LankaSt. Vincent and the GrenadinesSub-Saharan Africa Sub-Saharan Africa (excluding high income)Sub-Saharan Africa (IDA & IBRD countries)SudanSwazilandSwedenSwitzerlandTajikistanTanzaniaThailandTongaTrinidad and TobagoTunisiaTurkeyTurkmenistanUgandaUkraineUnited Arab EmiratesUnited KingdomUnited StatesUpper middle incomeUruguayUzbekistanVanuatuVenezuela, RBVietnamWest Bank and GazaWorldYemen, Rep.ZambiaZimbabwe

La ligne de temps

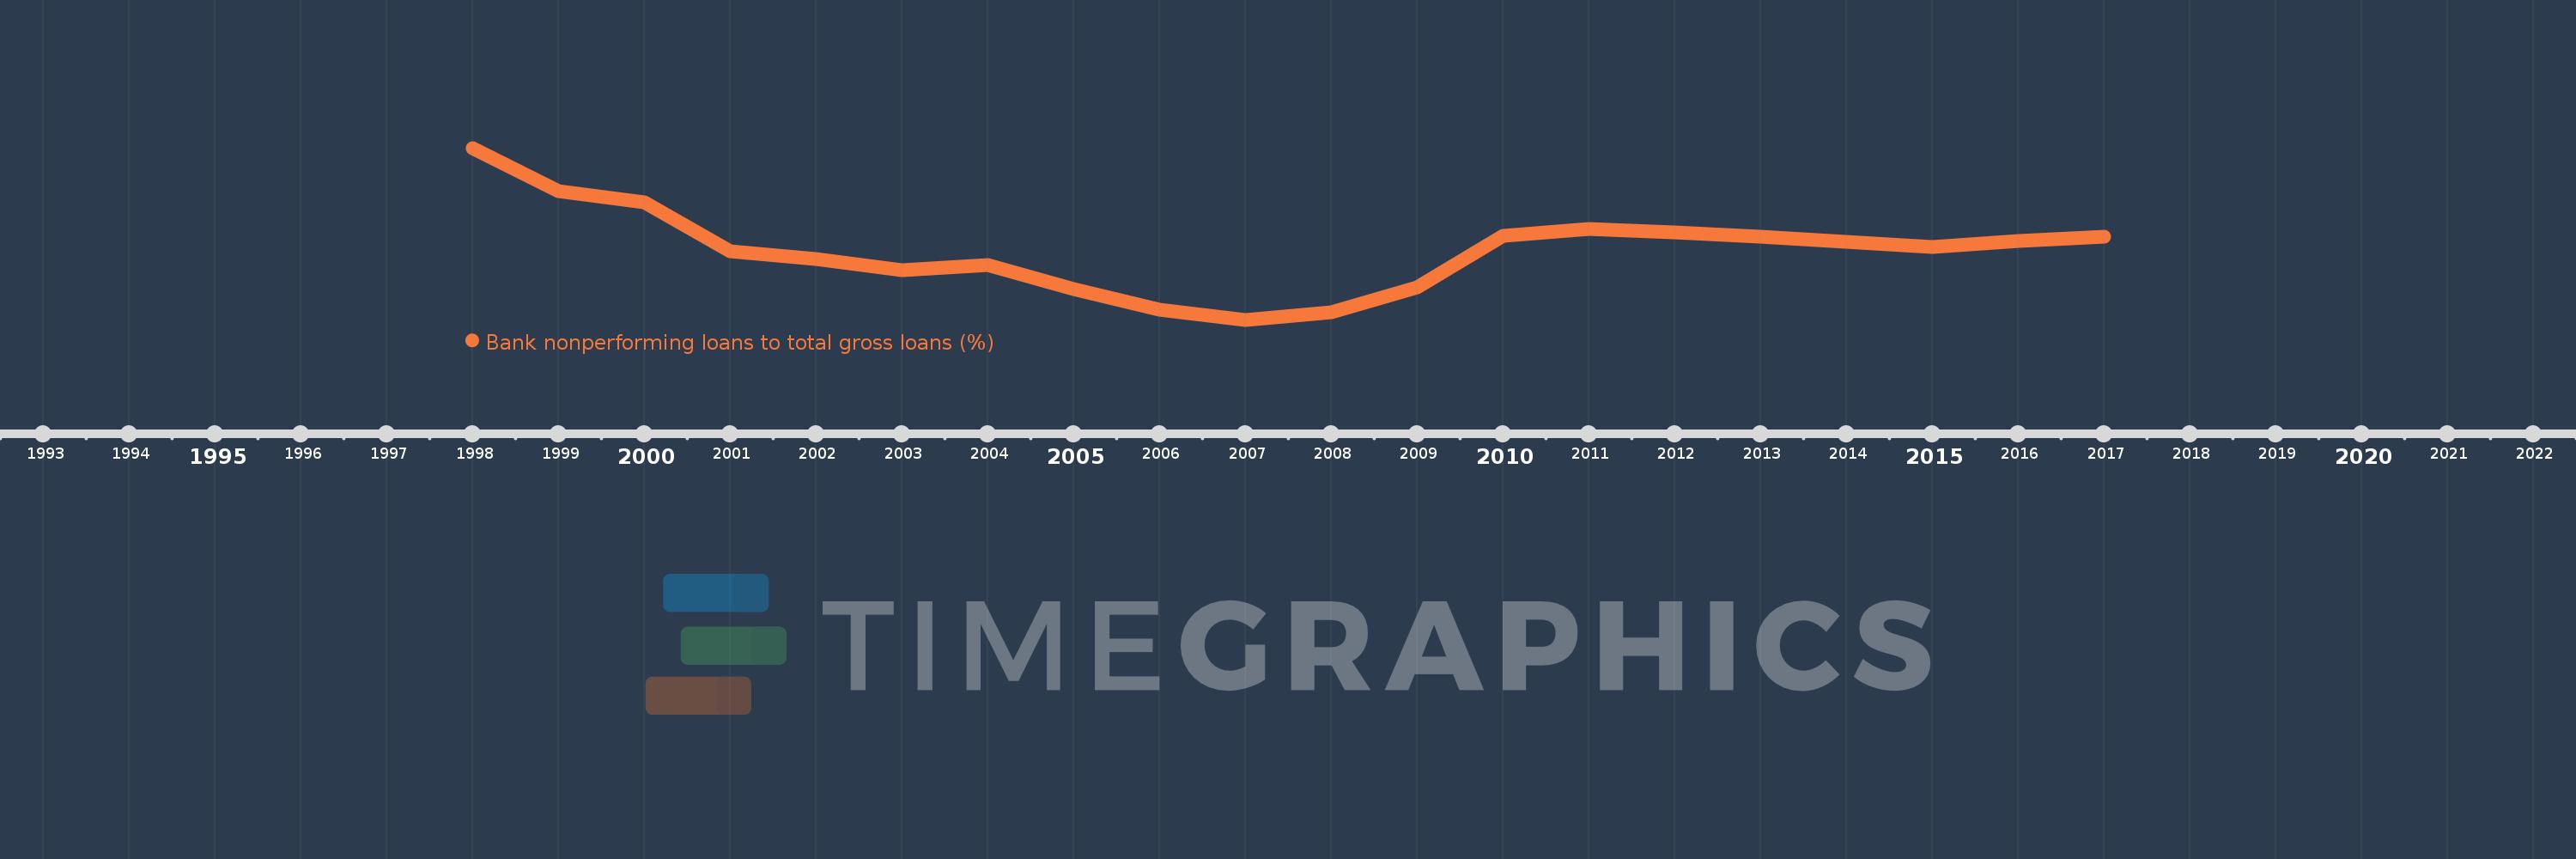
Cette échelle de temps montre un graphique de 1998 année à 2017 année OECD members. Les données jusqu'à 1997 année ne sont pas présentés. Quantité d'observations actuelles selon dates: 20.

Source (désignation):

Les indicateurs du développement mondiale

Source (organisation):

International Monetary Fund, Global Financial Stability Report.

Catégories:

Financial Sector

Dernière mise à jour

23 avr. 2017

Les indicateurs de changement de valeurs selon les années

En moyenne:
2.933
Minimum:
1.09
1 janv. 2007
Maximum:
5.65
1 janv. 1998
Pour la date d''observation
Valeur
Changement absolu
Le changement par rapport à la valeur précédente
1 janv. 1998
5.65
+5.65
0.0%
1 janv. 1999
4.5
-1.15
-20.35%
1 janv. 2000
4.2
-0.3
-6.67%
1 janv. 2001
2.9
-1.3
-30.95%
1 janv. 2002
2.7
-0.2
-6.9%
1 janv. 2003
2.4
-0.3
-11.11%
1 janv. 2004
2.55
+0.15
6.25%
1 janv. 2005
1.9
-0.65
-25.49%
1 janv. 2006
1.35
-0.55
-28.95%
1 janv. 2007
1.09
-0.26
-19.26%
1 janv. 2008
1.282
+0.192
17.57%
1 janv. 2009
1.945
+0.663
51.75%
1 janv. 2010
3.31
+1.365
70.21%
1 janv. 2011
3.49
+0.18
5.43%
1 janv. 2012
3.419
-0.071
-2.02%
1 janv. 2013
3.3
-0.119
-3.48%
1 janv. 2014
3.169
-0.131
-3.96%
1 janv. 2015
3.01
-0.16
-5.04%
1 janv. 2016
3.19
+0.181
6.0%
1 janv. 2017
3.301
+0.11
3.46%

Classement des pays selon les statistiques actuelles par années