29
/fr/
fr
AIzaSyAYiBZKx7MnpbEhh9jyipgxe19OcubqV5w
April 1, 2024
39730
IDA total
IDA
false
2
1
Average transaction cost of sending remittances to a specific country (%)
2016,2015,2014,2013,2012
Download
Bibliothèque de statistiques globales →IDA total →

Average transaction cost of sending remittances to a specific country (%)

Cette statistique dans les autres pays:
AfghanistanAlbaniaAlgeriaAngolaArab WorldArmeniaAzerbaijanBangladeshBelarusBoliviaBosnia and HerzegovinaBotswanaBrazilBulgariaCabo VerdeCambodiaCameroonCaribbean small statesCentral Europe and the BalticsChinaColombiaCongo, Rep.Costa RicaCote d'IvoireCroatiaDominican RepublicEarly-demographic dividendEast Asia & Pacific (excluding high income)East Asia & Pacific (IDA & IBRD countries)EcuadorEgypt, Arab Rep.El SalvadorEritreaEstoniaEthiopiaEurope & Central AsiaEurope & Central Asia (excluding high income)Europe & Central Asia (IDA & IBRD countries)FijiFragile and conflict affected situationsGambia, TheGeorgiaGhanaGuatemalaGuyanaHaitiHeavily indebted poor countries (HIPC)HondurasHungaryIBRD onlyIDA & IBRD totalIDA blendIDA onlyIDA totalIndiaIndonesiaJamaicaJordanKazakhstanKenyaKiribatiKorea, Rep.KosovoKyrgyz RepublicLao PDRLate-demographic dividendLatin America & Caribbean Latin America & Caribbean (excluding high income)Latin America & the Caribbean (IDA & IBRD countries)LatviaLeast developed countries: UN classificationLebanonLesothoLiberiaLithuaniaLow & middle incomeLow incomeLower middle incomeMacedonia, FYRMadagascarMalawiMalaysiaMaliMexicoMiddle East & North Africa (excluding high income)Middle East & North Africa (IDA & IBRD countries)Middle incomeMoldovaMoroccoMozambiqueMyanmarNepalNicaraguaNigeriaPakistanPanamaPapua New GuineaParaguayPeruPhilippinesPolandPre-demographic dividendRomaniaRwandaSamoaSenegalSerbiaSierra LeoneSolomon IslandsSomaliaSouth AfricaSouth AsiaSouth Asia (IDA & IBRD)Sri LankaSub-Saharan Africa Sub-Saharan Africa (excluding high income)Sub-Saharan Africa (IDA & IBRD countries)SudanSurinameSwazilandSyrian Arab RepublicTajikistanTanzaniaThailandTogoTongaTunisiaTurkeyTuvaluUgandaUkraineUpper middle incomeUzbekistanVanuatuVietnamWorldYemen, Rep.ZambiaZimbabwe
La ligne de temps
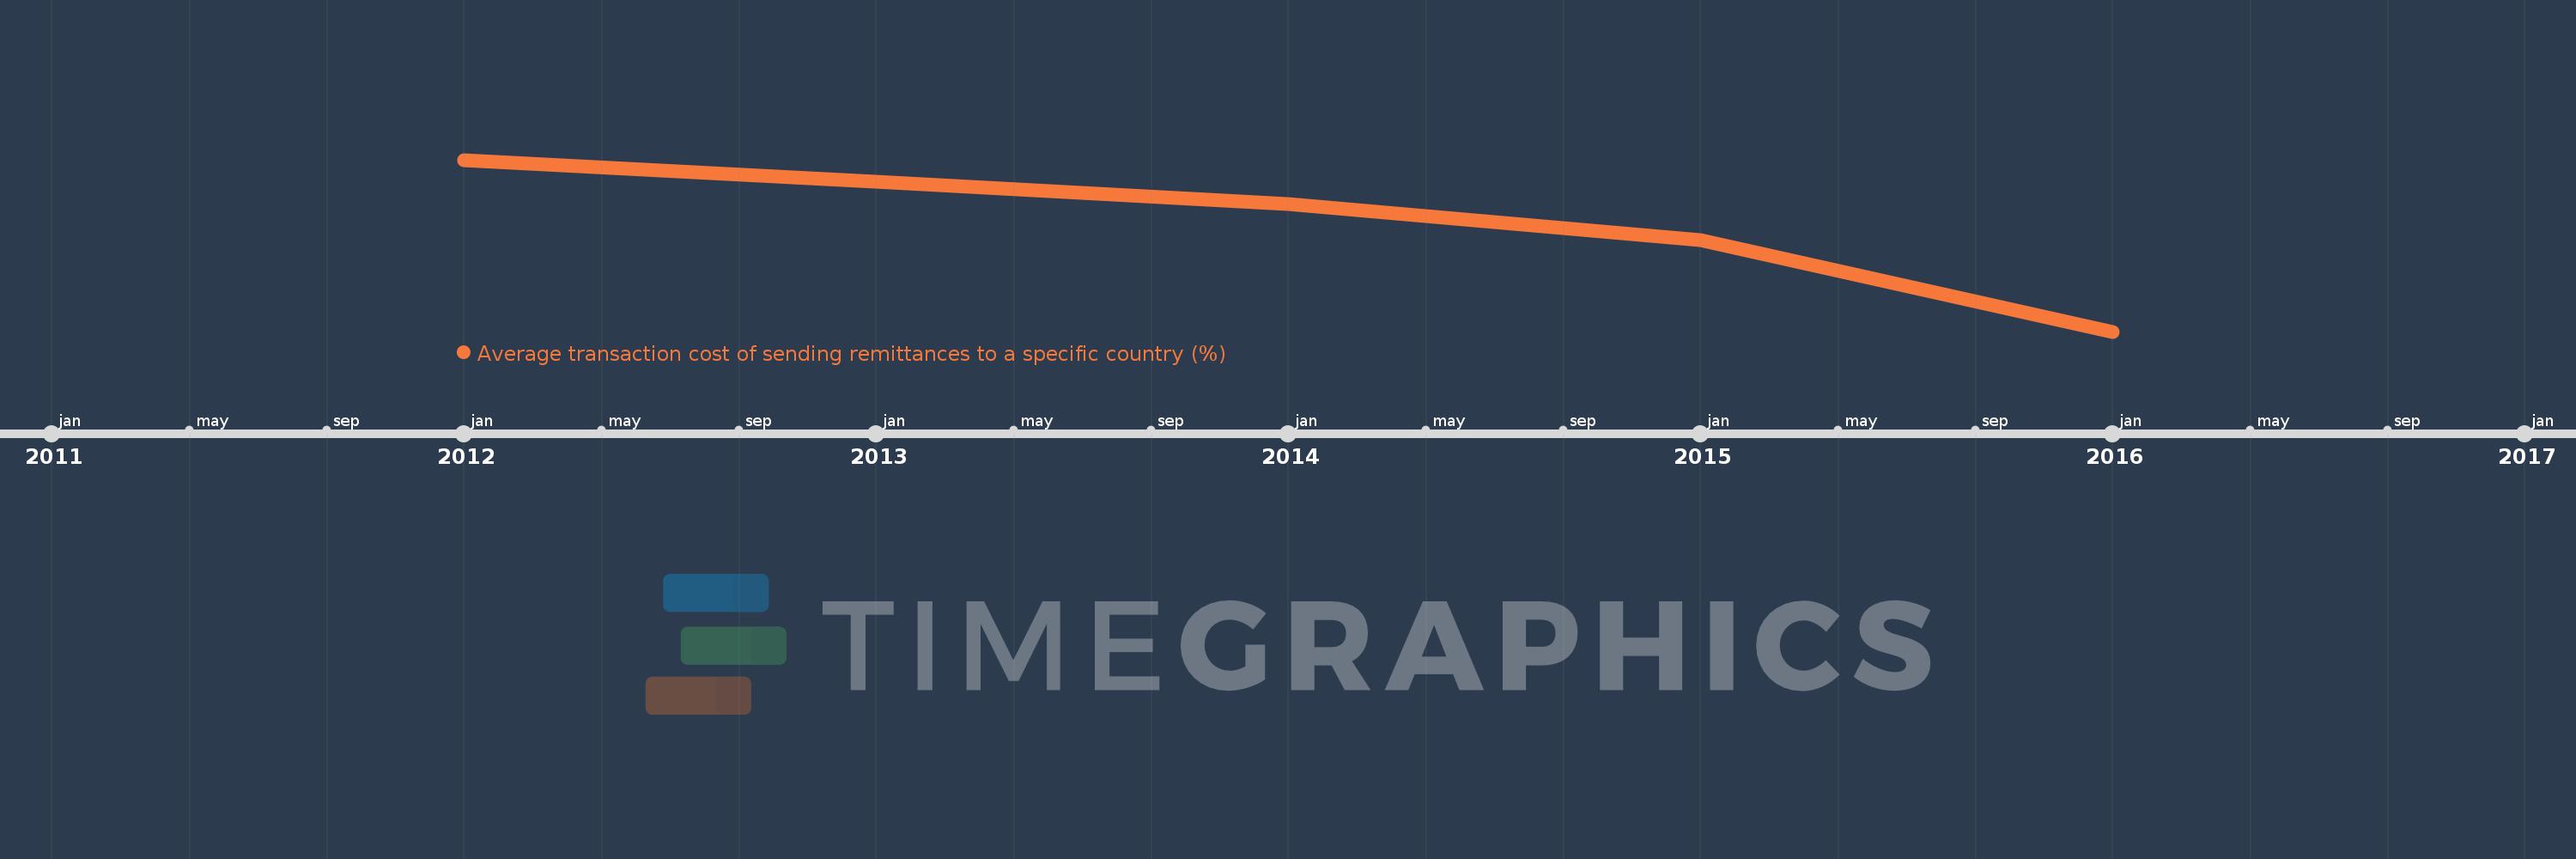
Cette échelle de temps montre un graphique de 2012 année à 2016 année IDA total. Les données jusqu'à 2011 année ne sont pas présentés. Quantité d'observations actuelles selon dates: 5.
Source (désignation):
Les indicateurs du développement mondiale
Source (organisation):
World Bank, Remittance Prices Worldwide, available at http://remittanceprices.worldbank.org
Catégories:
Financial Sector
Dernière mise à jour
23 avr. 2017
Les indicateurs de changement de valeurs selon les années
En moyenne:
9.162
Minimum:
7.959
1 janv. 2016
Maximum:
9.87
1 janv. 2012
Pour la date d''observation
Valeur
Changement absolu
Le changement par rapport à la valeur précédente
1 janv. 2012
9.87
+9.87
0.0%
1 janv. 2013
9.631
-0.239
-2.42%
1 janv. 2014
9.374
-0.257
-2.67%
1 janv. 2015
8.973
-0.401
-4.28%
1 janv. 2016
7.959
-1.013
-11.29%
Classement des pays selon les statistiques actuelles par années

Commentaires:

Envoyer
PremiumAbout & FeedbackUn accordConfidentialité
logo
© 2022 Selected Technologies LLC – Morgan Hill, California