33
/fr/
AIzaSyAYiBZKx7MnpbEhh9jyipgxe19OcubqV5w
May 1, 2025
137667
Georgia
GEO
true
2
1
Average transaction cost of sending remittances to a specific country (%)
2016,2015,2014,2013,2012
Download
Bibliothèque de statistiques globales →Georgia →

Average transaction cost of sending remittances to a specific country (%)

Cette statistique dans les autres pays:

AfghanistanAlbaniaAlgeriaAngolaArab WorldArmeniaAzerbaijanBangladeshBelarusBoliviaBosnia and HerzegovinaBotswanaBrazilBulgariaCabo VerdeCambodiaCameroonCaribbean small statesCentral Europe and the BalticsChinaColombiaCongo, Rep.Costa RicaCote d'IvoireCroatiaDominican RepublicEarly-demographic dividendEast Asia & Pacific (excluding high income)East Asia & Pacific (IDA & IBRD countries)EcuadorEgypt, Arab Rep.El SalvadorEritreaEstoniaEthiopiaEurope & Central AsiaEurope & Central Asia (excluding high income)Europe & Central Asia (IDA & IBRD countries)FijiFragile and conflict affected situationsGambia, TheGeorgiaGhanaGuatemalaGuyanaHaitiHeavily indebted poor countries (HIPC)HondurasHungaryIBRD onlyIDA & IBRD totalIDA blendIDA onlyIDA totalIndiaIndonesiaJamaicaJordanKazakhstanKenyaKiribatiKorea, Rep.KosovoKyrgyz RepublicLao PDRLate-demographic dividendLatin America & Caribbean Latin America & Caribbean (excluding high income)Latin America & the Caribbean (IDA & IBRD countries)LatviaLeast developed countries: UN classificationLebanonLesothoLiberiaLithuaniaLow & middle incomeLow incomeLower middle incomeMacedonia, FYRMadagascarMalawiMalaysiaMaliMexicoMiddle East & North Africa (excluding high income)Middle East & North Africa (IDA & IBRD countries)Middle incomeMoldovaMoroccoMozambiqueMyanmarNepalNicaraguaNigeriaPakistanPanamaPapua New GuineaParaguayPeruPhilippinesPolandPre-demographic dividendRomaniaRwandaSamoaSenegalSerbiaSierra LeoneSolomon IslandsSomaliaSouth AfricaSouth AsiaSouth Asia (IDA & IBRD)Sri LankaSub-Saharan Africa Sub-Saharan Africa (excluding high income)Sub-Saharan Africa (IDA & IBRD countries)SudanSurinameSwazilandSyrian Arab RepublicTajikistanTanzaniaThailandTogoTongaTunisiaTurkeyTuvaluUgandaUkraineUpper middle incomeUzbekistanVanuatuVietnamWorldYemen, Rep.ZambiaZimbabwe

La ligne de temps

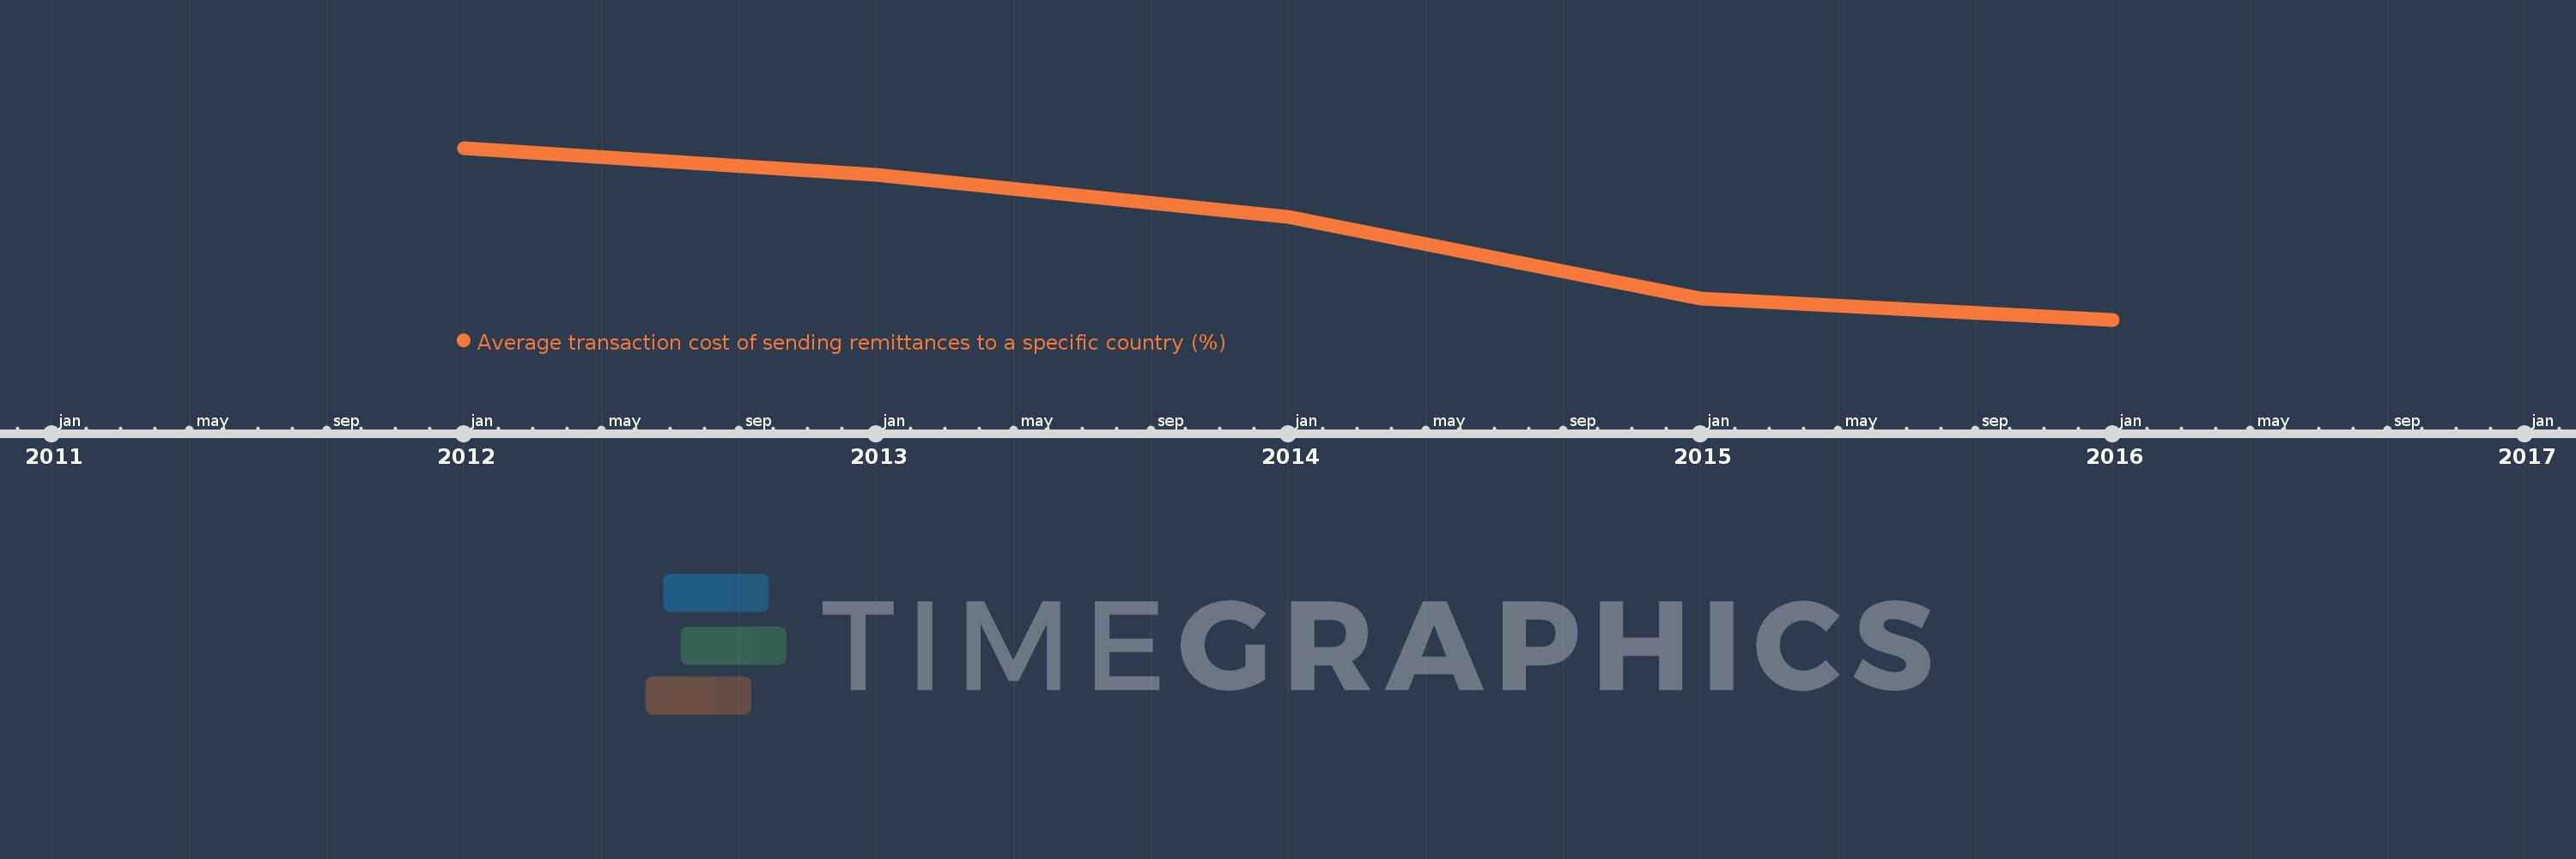
Cette échelle de temps montre un graphique de 2012 année à 2016 année Georgia. Les données jusqu'à 2011 année ne sont pas présentés. Quantité d'observations actuelles selon dates: 5.

Source (désignation):

Les indicateurs du développement mondiale

Source (organisation):

World Bank, Remittance Prices Worldwide, available at http://remittanceprices.worldbank.org

Catégories:

Financial Sector

Dernière mise à jour

23 avr. 2017

Les indicateurs de changement de valeurs selon les années

En moyenne:
1.959
Minimum:
1.361
1 janv. 2016
Maximum:
2.527
1 janv. 2012
Pour la date d''observation
Valeur
Changement absolu
Le changement par rapport à la valeur précédente
1 janv. 2012
2.527
+2.527
0.0%
1 janv. 2013
2.343
-0.184
-7.29%
1 janv. 2014
2.059
-0.284
-12.12%
1 janv. 2015
1.503
-0.557
-27.03%
1 janv. 2016
1.361
-0.142
-9.45%

Classement des pays selon les statistiques actuelles par années