33
/fr/
AIzaSyB4mHJ5NPEv-XzF7P6NDYXjlkCWaeKw5bc
November 1, 2025
287136
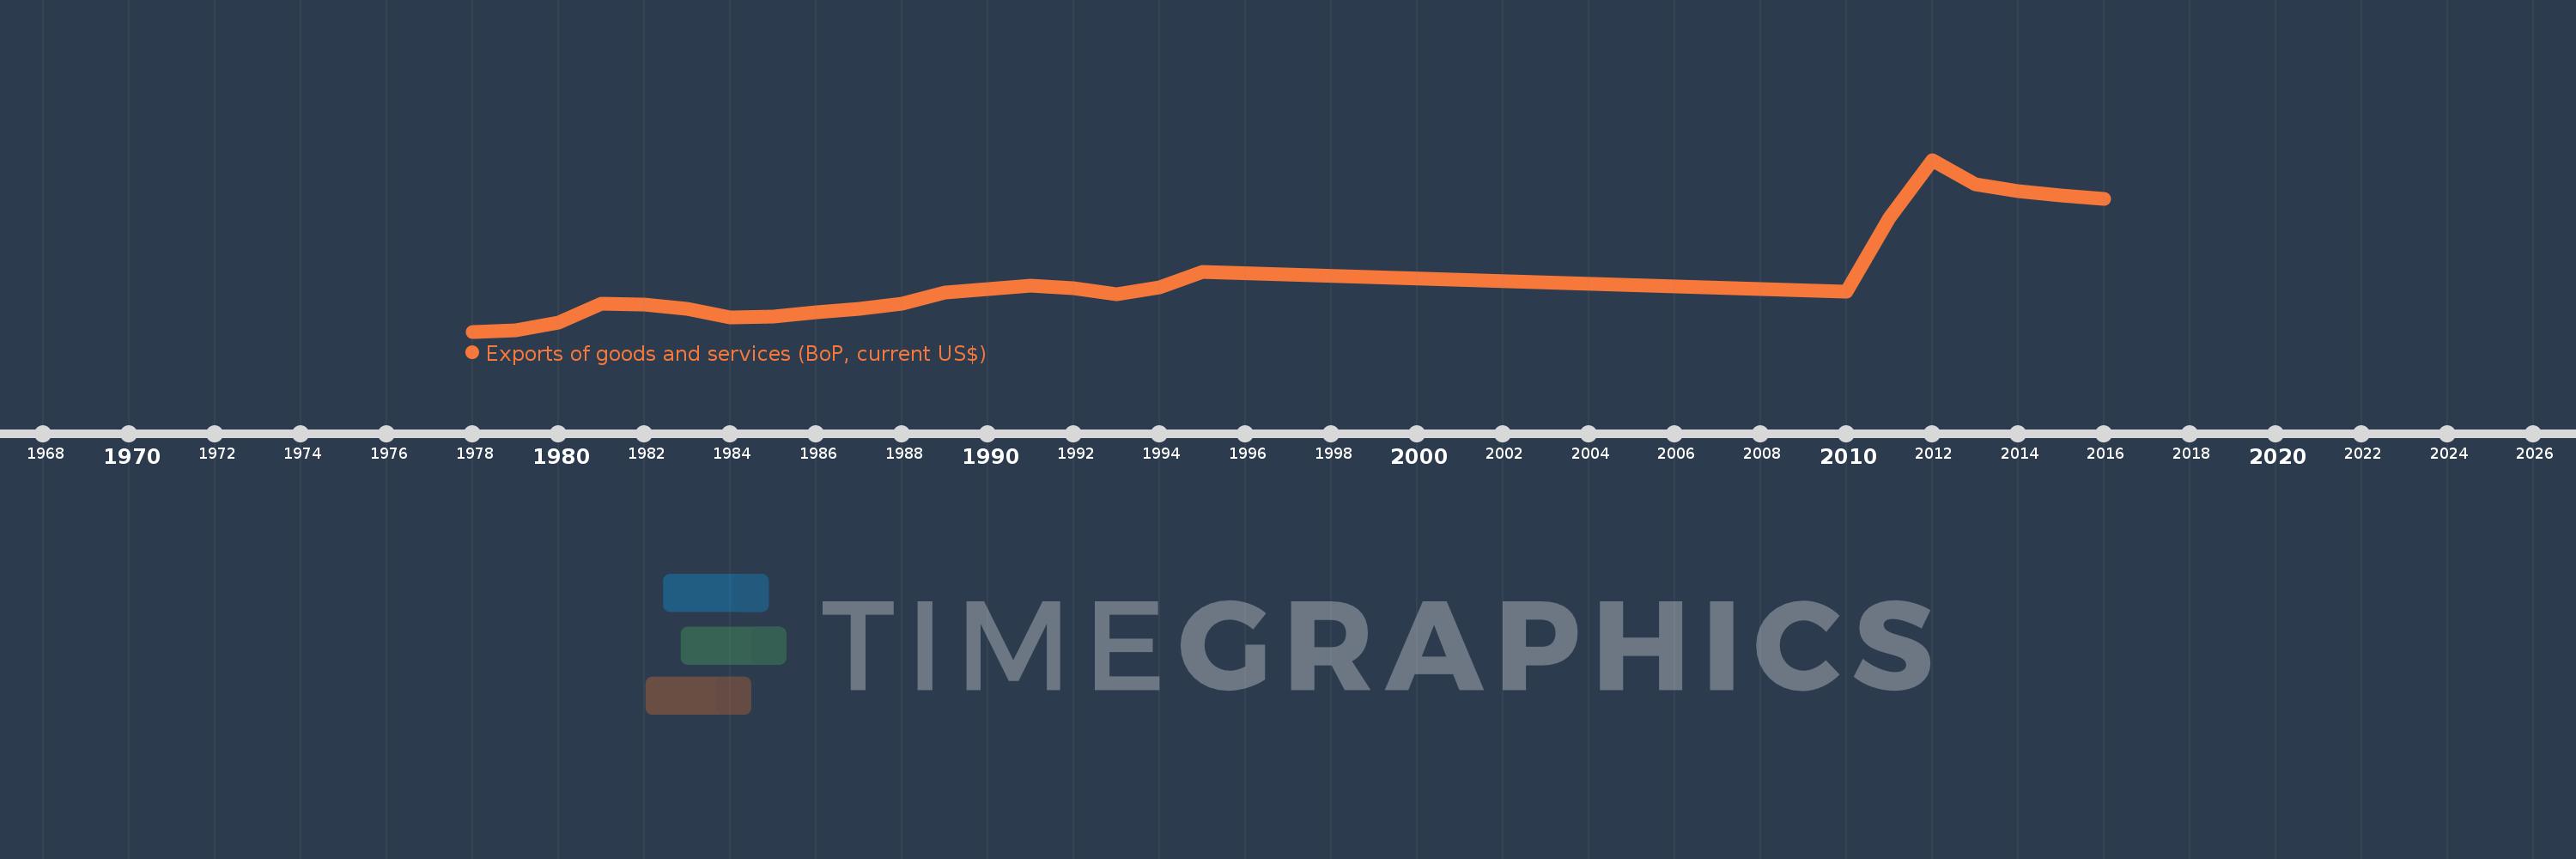
Zimbabwe
ZWE
true
2
1
Exports of goods and services (BoP, current US$)
2016,2015,2014,2013,2012,2011,2010,1995,1994,1993,1992,1991,1990,1989,1988,1987,1986,1985,1984,1983,1982,1981,1980,1979,1978