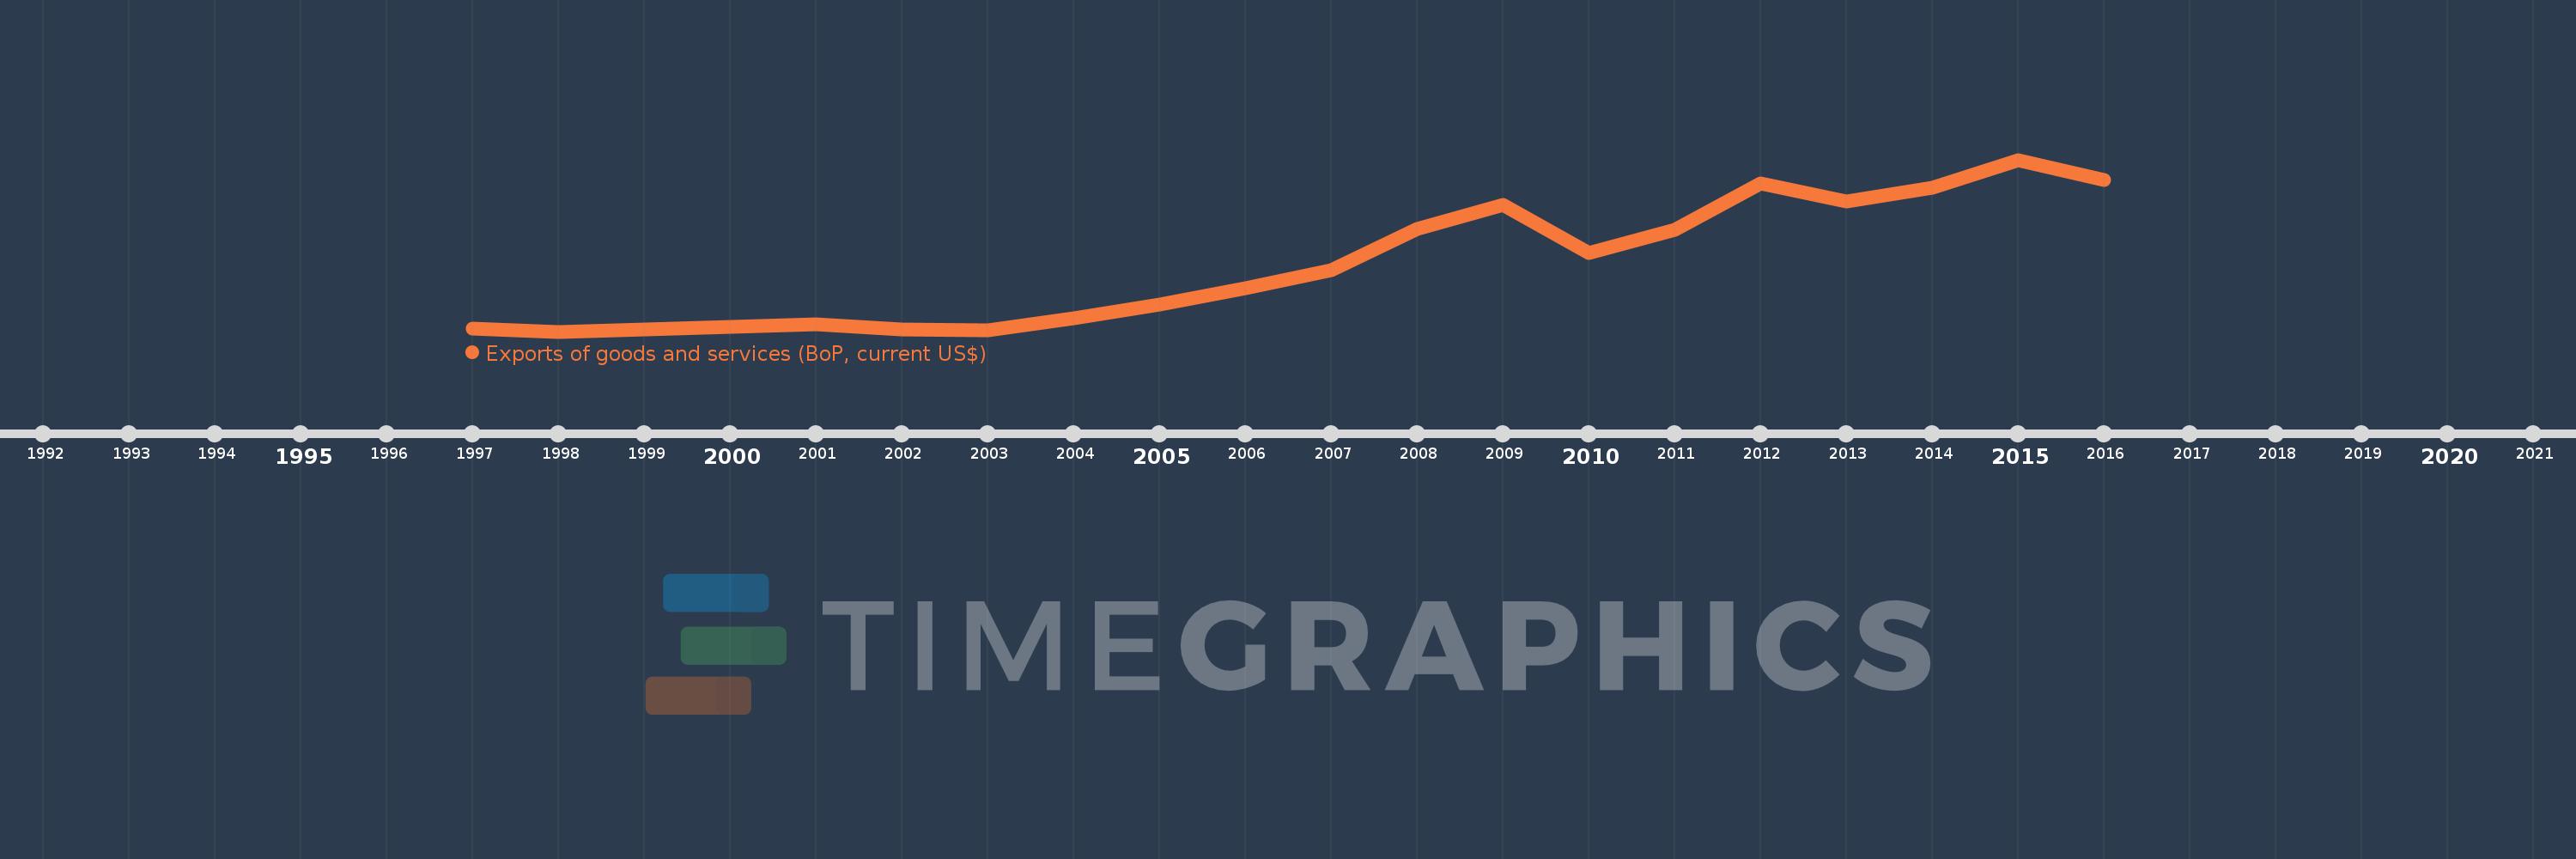
Cette échelle de temps montre un graphique de 1997 année à 2016 année Macedonia, FYR. Les données jusqu'à 1996 année ne sont pas présentés. Quantité d'observations actuelles selon dates: 20.
Source (désignation):
Les indicateurs du développement mondiale
Source (organisation):
International Monetary Fund, Balance of Payments Statistics Yearbook and data files.
Catégories:
Economy & Growth, Trade
Dernière mise à jour
23 avr. 2017
Les indicateurs de changement de valeurs selon les années
En moyenne:
2.672 mds
Minimum:
956.31 mln.
1 janv. 1998
Maximum:
5.417 mds
1 janv. 2015
Pour la date d''observation
Valeur
Changement absolu
Le changement par rapport à la valeur précédente
1 janv. 1997
1.043 mds
+1.043 mds
0.0%
1 janv. 1998
956.31 mln.
-86.54 mln.
-8.3%
1 janv. 1999
1.008 mds
+51.888 mln.
5.43%
1 janv. 2000
1.087 mds
+78.66 mln.
7.8%
1 janv. 2001
1.136 mds
+49.016 mln.
4.51%
1 janv. 2002
1.017 mds
-119.235 mln.
-10.5%
1 janv. 2003
985.136 mln.
-31.502 mln.
-3.1%
1 janv. 2004
1.3 mds
+314.403 mln.
31.91%
1 janv. 2005
1.669 mds
+369.264 mln.
28.42%
1 janv. 2006
2.093 mds
+424.585 mln.
25.44%
1 janv. 2007
2.546 mds
+452.374 mln.
21.61%
1 janv. 2008
3.612 mds
+1.066 mds
41.87%
1 janv. 2009
4.257 mds
+645.342 mln.
17.87%
1 janv. 2010
2.996 mds
-1.261 mds
-29.63%
1 janv. 2011
3.606 mds
+610.784 mln.
20.39%
1 janv. 2012
4.794 mds
+1.188 mds
32.93%
1 janv. 2013
4.332 mds
-461.959 mln.
-9.64%
1 janv. 2014
4.689 mds
+356.998 mln.
8.24%
1 janv. 2015
5.417 mds
+727.688 mln.
15.52%
1 janv. 2016
4.891 mds
-526.296 mln.
-9.72%
Classement des pays selon les statistiques actuelles par années