29
/fr/
fr
AIzaSyAYiBZKx7MnpbEhh9jyipgxe19OcubqV5w
April 1, 2024
283217
Virgin Islands (U.S.)
VIR
true
2
1
GDP (constant LCU)
1990,1989,1988,1987,1986,1985,1984,1983,1982,1981,1980,1979,1978,1977,1976,1975,1974,1973,1972,1971
Download
Bibliothèque de statistiques globales →Virgin Islands (U.S.) →

GDP (constant LCU)

Cette statistique dans les autres pays:
AfghanistanAlbaniaAlgeriaAndorraAngolaAntigua and BarbudaArgentinaArmeniaArubaAustraliaAustriaAzerbaijanBahamas, TheBahrainBangladeshBarbadosBelarusBelgiumBelizeBeninBermudaBhutanBoliviaBosnia and HerzegovinaBotswanaBrazilBrunei DarussalamBulgariaBurkina FasoBurundiCabo VerdeCambodiaCameroonCanadaCayman IslandsCentral African RepublicChadChannel IslandsChileChinaColombiaComorosCongo, Dem. Rep.Congo, Rep.Costa RicaCote d'IvoireCroatiaCubaCyprusCzech RepublicDenmarkDjiboutiDominicaDominican RepublicEcuadorEgypt, Arab Rep.El SalvadorEquatorial GuineaEritreaEstoniaEthiopiaFijiFinlandFranceFrench PolynesiaGabonGambia, TheGeorgiaGermanyGhanaGreeceGreenlandGrenadaGuatemalaGuineaGuinea-BissauGuyanaHaitiHondurasHong Kong SAR, ChinaHungaryIcelandIndiaIndonesiaIran, Islamic Rep.IraqIrelandIsle of ManIsraelItalyJamaicaJapanJordanKazakhstanKenyaKiribatiKorea, Rep.KosovoKuwaitKyrgyz RepublicLao PDRLatviaLebanonLesothoLiberiaLibyaLiechtensteinLithuaniaLuxembourgMacao SAR, ChinaMacedonia, FYRMadagascarMalawiMalaysiaMaldivesMaliMaltaMarshall IslandsMauritaniaMauritiusMexicoMicronesia, Fed. Sts.MoldovaMonacoMongoliaMontenegroMoroccoMozambiqueMyanmarNamibiaNauruNepalNetherlandsNew CaledoniaNew ZealandNicaraguaNigerNigeriaNorwayOmanPakistanPalauPanamaPapua New GuineaParaguayPeruPhilippinesPolandPortugalPuerto RicoQatarRomaniaRussian FederationRwandaSamoaSan MarinoSao Tome and PrincipeSaudi ArabiaSenegalSerbiaSeychellesSierra LeoneSingaporeSlovak RepublicSloveniaSolomon IslandsSomaliaSouth AfricaSouth SudanSpainSri LankaSt. Kitts and NevisSt. LuciaSt. Vincent and the GrenadinesSudanSurinameSwazilandSwedenSwitzerlandSyrian Arab RepublicTajikistanTanzaniaThailandTimor-LesteTogoTongaTrinidad and TobagoTunisiaTurkeyTurkmenistanTuvaluUgandaUkraineUnited Arab EmiratesUnited KingdomUnited StatesUruguayUzbekistanVanuatuVenezuela, RBVietnamVirgin Islands (U.S.)West Bank and GazaYemen, Rep.ZambiaZimbabwe
La ligne de temps
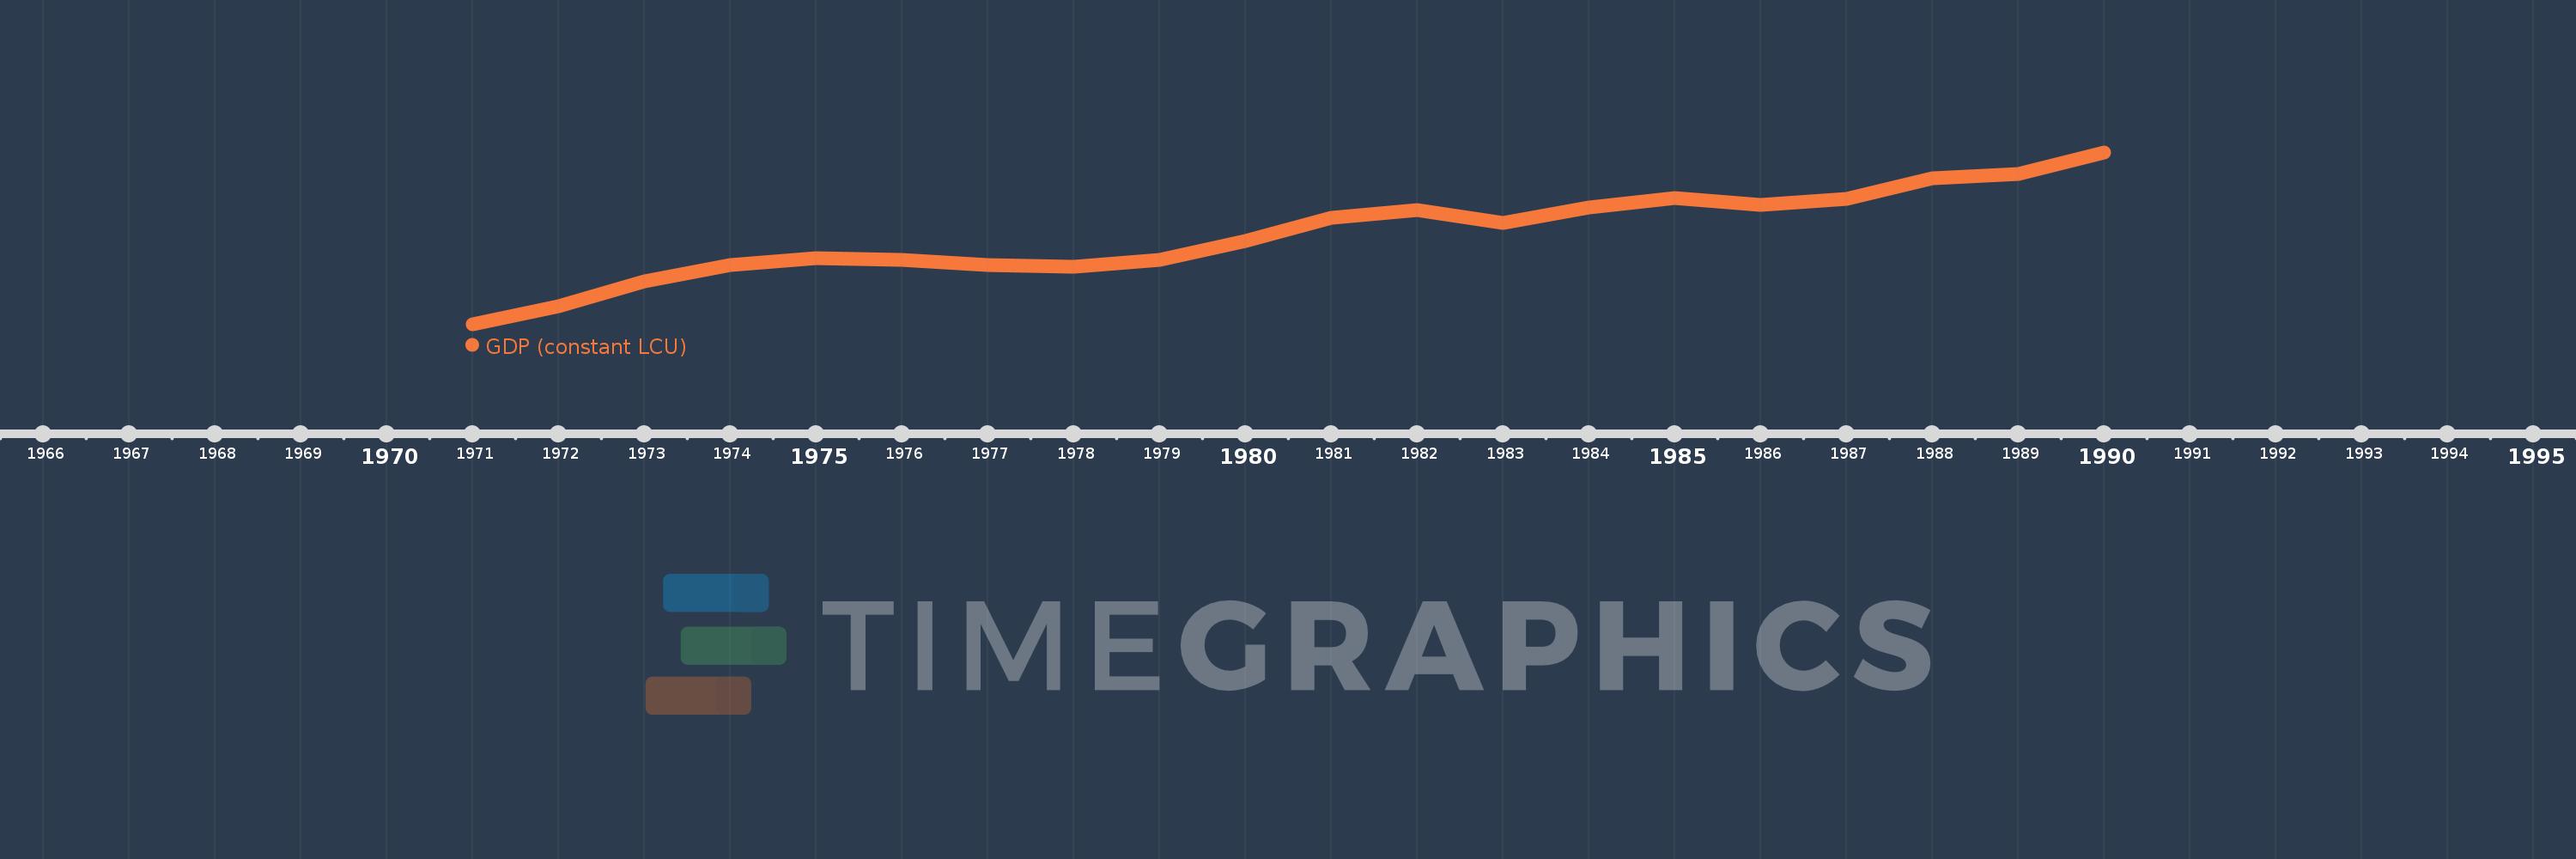
Cette échelle de temps montre un graphique de 1971 année à 1990 année Virgin Islands (U.S.). Les données jusqu'à 1970 année ne sont pas présentés. Quantité d'observations actuelles selon dates: 20.
Source (désignation):
Les indicateurs du développement mondiale
Source (organisation):
World Bank national accounts data, and OECD National Accounts data files.
Catégories:
Economy & Growth
Dernière mise à jour
23 avr. 2017
Les indicateurs de changement de valeurs selon les années
En moyenne:
793.275 mln.
Minimum:
497.6 mln.
1 janv. 1971
Maximum:
1.064 mds
1 janv. 1990
Pour la date d''observation
Valeur
Changement absolu
Le changement par rapport à la valeur précédente
1 janv. 1971
497.6 mln.
+497.6 mln.
0.0%
1 janv. 1972
557.7 mln.
+60.1 mln.
12.08%
1 janv. 1973
639.5 mln.
+81.8 mln.
14.67%
1 janv. 1974
692.4 mln.
+52.9 mln.
8.27%
1 janv. 1975
714.7 mln.
+22.3 mln.
3.22%
1 janv. 1976
710.3 mln.
-4.4 mln.
-0.62%
1 janv. 1977
693.8 mln.
-16.5 mln.
-2.32%
1 janv. 1978
686.4 mln.
-7.4 mln.
-1.07%
1 janv. 1979
710.1 mln.
+23.7 mln.
3.45%
1 janv. 1980
773.1 mln.
+63.0 mln.
8.87%
1 janv. 1981
849.2 mln.
+76.1 mln.
9.84%
1 janv. 1982
874.3 mln.
+25.1 mln.
2.96%
1 janv. 1983
832.6 mln.
-41.7 mln.
-4.77%
1 janv. 1984
882.5 mln.
+49.9 mln.
5.99%
1 janv. 1985
914.1 mln.
+31.6 mln.
3.58%
1 janv. 1986
892.3 mln.
-21.8 mln.
-2.38%
1 janv. 1987
910.1 mln.
+17.8 mln.
1.99%
1 janv. 1988
977.7 mln.
+67.6 mln.
7.43%
1 janv. 1989
993.1 mln.
+15.4 mln.
1.58%
1 janv. 1990
1.064 mds
+70.9 mln.
7.14%
Classement des pays selon les statistiques actuelles par années

Commentaires:

Envoyer
PremiumAbout & FeedbackUn accordConfidentialité
logo
© 2022 Selected Technologies LLC – Morgan Hill, California