33
/fr/
AIzaSyAYiBZKx7MnpbEhh9jyipgxe19OcubqV5w
August 1, 2025
217479
Palau
PLW
true
2
1
GDP (constant LCU)
2016,2015,2014,2013,2012,2011,2010,2009,2008,2007,2006,2005,2004,2003,2002,2001,2000,1999,1998,1997,1996,1995,1994,1993,1992
Download
Bibliothèque de statistiques globales →Palau →

GDP (constant LCU)

Cette statistique dans les autres pays:

AfghanistanAlbaniaAlgeriaAndorraAngolaAntigua and BarbudaArgentinaArmeniaArubaAustraliaAustriaAzerbaijanBahamas, TheBahrainBangladeshBarbadosBelarusBelgiumBelizeBeninBermudaBhutanBoliviaBosnia and HerzegovinaBotswanaBrazilBrunei DarussalamBulgariaBurkina FasoBurundiCabo VerdeCambodiaCameroonCanadaCayman IslandsCentral African RepublicChadChannel IslandsChileChinaColombiaComorosCongo, Dem. Rep.Congo, Rep.Costa RicaCote d'IvoireCroatiaCubaCyprusCzech RepublicDenmarkDjiboutiDominicaDominican RepublicEcuadorEgypt, Arab Rep.El SalvadorEquatorial GuineaEritreaEstoniaEthiopiaFijiFinlandFranceFrench PolynesiaGabonGambia, TheGeorgiaGermanyGhanaGreeceGreenlandGrenadaGuatemalaGuineaGuinea-BissauGuyanaHaitiHondurasHong Kong SAR, ChinaHungaryIcelandIndiaIndonesiaIran, Islamic Rep.IraqIrelandIsle of ManIsraelItalyJamaicaJapanJordanKazakhstanKenyaKiribatiKorea, Rep.KosovoKuwaitKyrgyz RepublicLao PDRLatviaLebanonLesothoLiberiaLibyaLiechtensteinLithuaniaLuxembourgMacao SAR, ChinaMacedonia, FYRMadagascarMalawiMalaysiaMaldivesMaliMaltaMarshall IslandsMauritaniaMauritiusMexicoMicronesia, Fed. Sts.MoldovaMonacoMongoliaMontenegroMoroccoMozambiqueMyanmarNamibiaNauruNepalNetherlandsNew CaledoniaNew ZealandNicaraguaNigerNigeriaNorwayOmanPakistanPalauPanamaPapua New GuineaParaguayPeruPhilippinesPolandPortugalPuerto RicoQatarRomaniaRussian FederationRwandaSamoaSan MarinoSao Tome and PrincipeSaudi ArabiaSenegalSerbiaSeychellesSierra LeoneSingaporeSlovak RepublicSloveniaSolomon IslandsSomaliaSouth AfricaSouth SudanSpainSri LankaSt. Kitts and NevisSt. LuciaSt. Vincent and the GrenadinesSudanSurinameSwazilandSwedenSwitzerlandSyrian Arab RepublicTajikistanTanzaniaThailandTimor-LesteTogoTongaTrinidad and TobagoTunisiaTurkeyTurkmenistanTuvaluUgandaUkraineUnited Arab EmiratesUnited KingdomUnited StatesUruguayUzbekistanVanuatuVenezuela, RBVietnamVirgin Islands (U.S.)West Bank and GazaYemen, Rep.ZambiaZimbabwe

La ligne de temps

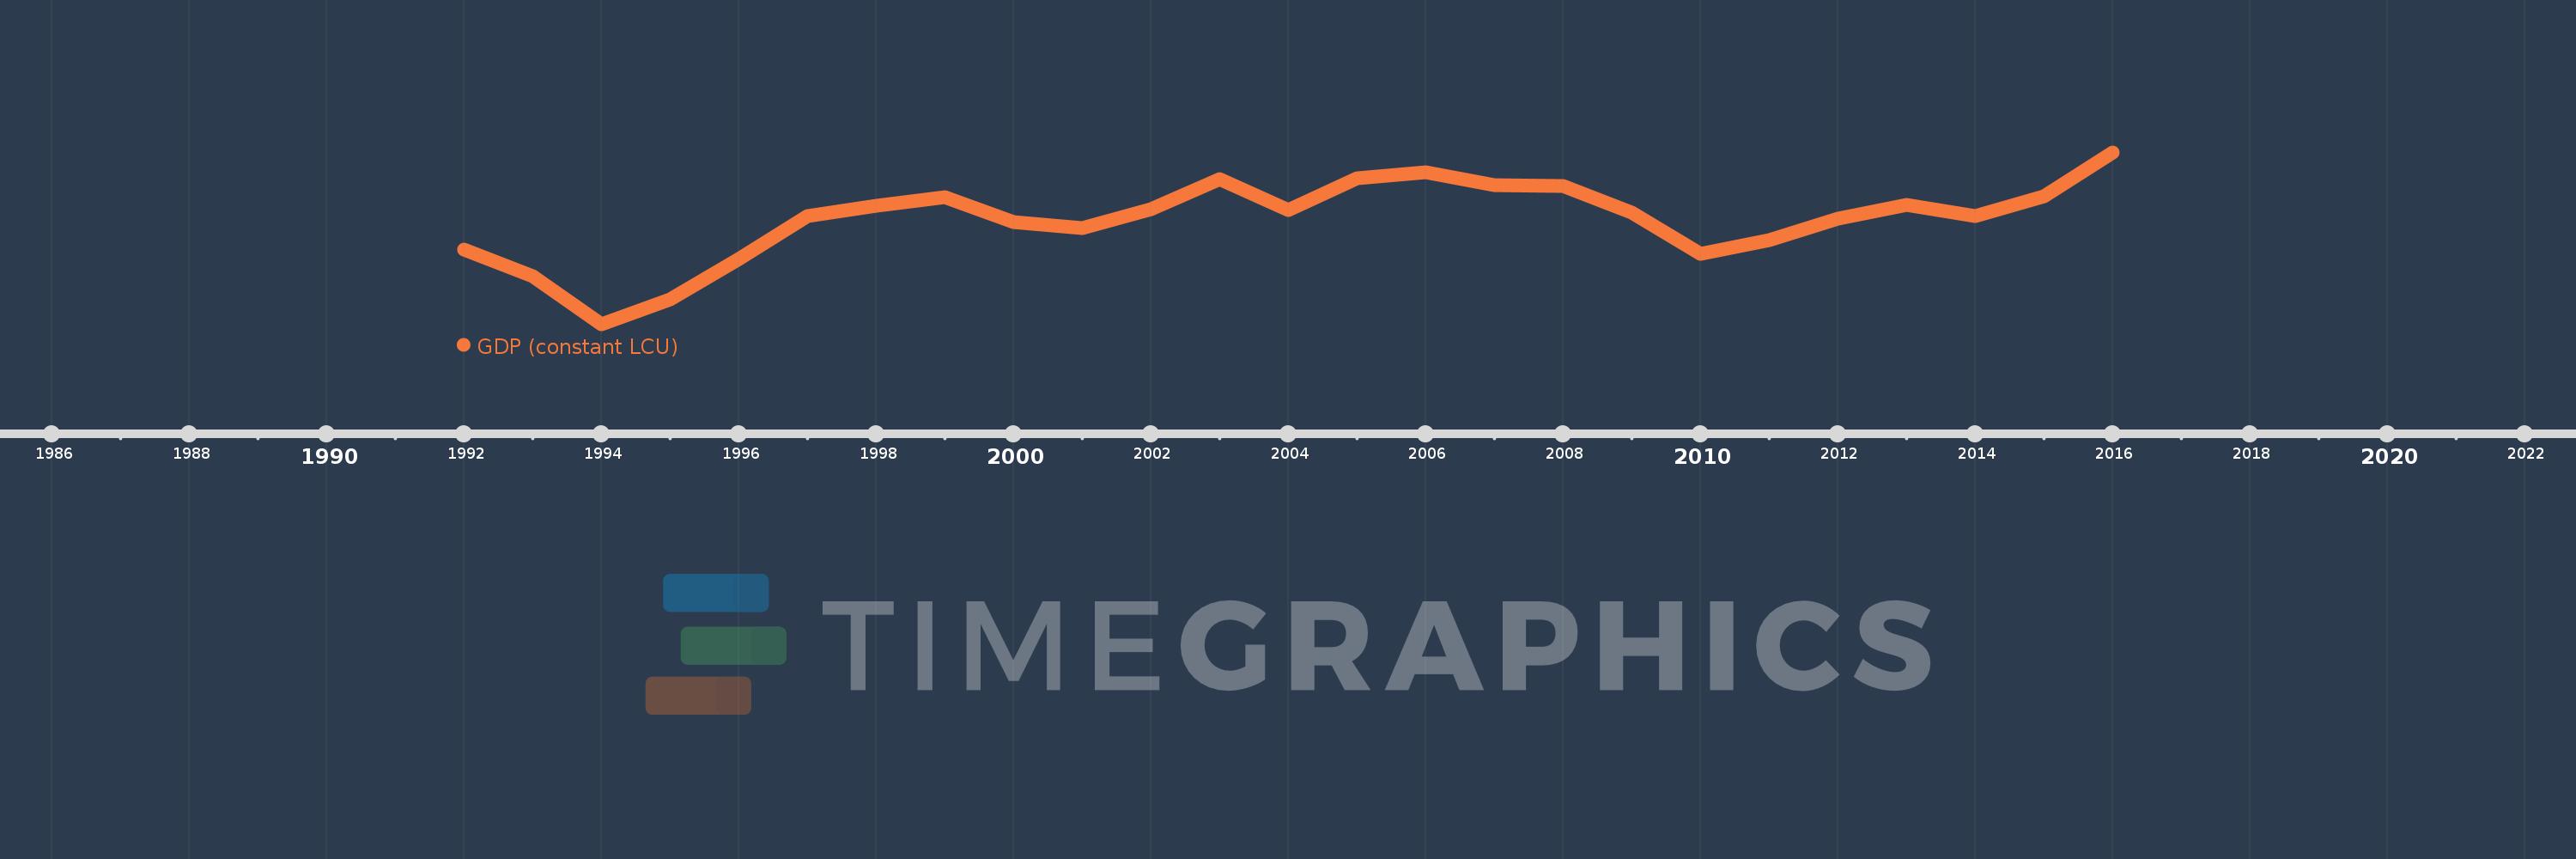
Cette échelle de temps montre un graphique de 1992 année à 2016 année Palau. Les données jusqu'à 1991 année ne sont pas présentés. Quantité d'observations actuelles selon dates: 25.

Source (désignation):

Les indicateurs du développement mondiale

Source (organisation):

World Bank national accounts data, and OECD National Accounts data files.

Catégories:

Economy & Growth

Dernière mise à jour

23 avr. 2017

Les indicateurs de changement de valeurs selon les années

En moyenne:
174.688 mln.
Minimum:
133.932 mln.
1 janv. 1994
Maximum:
200.9 mln.
1 janv. 2016
Pour la date d''observation
Valeur
Changement absolu
Le changement par rapport à la valeur précédente
1 janv. 1992
163.158 mln.
+163.158 mln.
0.0%
1 janv. 1993
152.716 mln.
-10.442 mln.
-6.4%
1 janv. 1994
133.932 mln.
-18.784 mln.
-12.3%
1 janv. 1995
143.709 mln.
+9.777 mln.
7.3%
1 janv. 1996
159.373 mln.
+15.664 mln.
10.9%
1 janv. 1997
175.948 mln.
+16.575 mln.
10.4%
1 janv. 1998
179.994 mln.
+4.047 mln.
2.3%
1 janv. 1999
183.594 mln.
+3.6 mln.
2.0%
1 janv. 2000
173.68 mln.
-9.914 mln.
-5.4%
1 janv. 2001
171.4 mln.
-2.28 mln.
-1.31%
1 janv. 2002
178.8 mln.
+7.4 mln.
4.32%
1 janv. 2003
190.6 mln.
+11.8 mln.
6.6%
1 janv. 2004
178.5 mln.
-12.1 mln.
-6.35%
1 janv. 2005
190.9 mln.
+12.4 mln.
6.95%
1 janv. 2006
193.3 mln.
+2.4 mln.
1.26%
1 janv. 2007
188.0 mln.
-5.3 mln.
-2.74%
1 janv. 2008
187.9 mln.
-100.0 milles
-0.05%
1 janv. 2009
177.4 mln.
-10.5 mln.
-5.59%
1 janv. 2010
161.3 mln.
-16.1 mln.
-9.08%
1 janv. 2011
166.6 mln.
+5.3 mln.
3.29%
1 janv. 2012
175.0 mln.
+8.4 mln.
5.04%
1 janv. 2013
180.6 mln.
+5.6 mln.
3.2%
1 janv. 2014
176.2 mln.
-4.4 mln.
-2.44%
1 janv. 2015
183.7 mln.
+7.5 mln.
4.26%
1 janv. 2016
200.9 mln.
+17.2 mln.
9.36%

Classement des pays selon les statistiques actuelles par années