33
/fr/
AIzaSyAYiBZKx7MnpbEhh9jyipgxe19OcubqV5w
August 1, 2025
279069
Uzbekistan
UZB
true
2
1
Net income from abroad (current US$)
2016,2015,2014,2013,2012,2011,2010,2009,2008,2007,2006,2005,2004,2003,2002,2001,2000,1999,1998,1997,1996,1995,1994,1993
Download
Bibliothèque de statistiques globales →Uzbekistan →

Net income from abroad (current US$)

Cette statistique dans les autres pays:

AfghanistanAlbaniaAlgeriaAndorraAngolaAntigua and BarbudaArgentinaArmeniaAustraliaAustriaAzerbaijanBahamas, TheBahrainBangladeshBarbadosBelarusBelgiumBelizeBeninBermudaBhutanBoliviaBosnia and HerzegovinaBotswanaBrazilBrunei DarussalamBulgariaBurkina FasoBurundiCabo VerdeCambodiaCameroonCanadaCentral African RepublicChadChannel IslandsChileChinaColombiaComorosCongo, Dem. Rep.Congo, Rep.Costa RicaCote d'IvoireCroatiaCubaCyprusCzech RepublicDenmarkDjiboutiDominicaDominican RepublicEcuadorEgypt, Arab Rep.El SalvadorEquatorial GuineaEritreaEstoniaEthiopiaFaroe IslandsFijiFinlandFranceFrench PolynesiaGabonGambia, TheGeorgiaGermanyGhanaGreeceGreenlandGrenadaGuatemalaGuineaGuinea-BissauGuyanaHaitiHondurasHong Kong SAR, ChinaHungaryIcelandIndiaIndonesiaIran, Islamic Rep.IraqIrelandIsraelItalyJamaicaJapanJordanKazakhstanKenyaKiribatiKorea, Rep.KosovoKuwaitKyrgyz RepublicLao PDRLatviaLebanonLesothoLiberiaLibyaLithuaniaLuxembourgMacao SAR, ChinaMacedonia, FYRMadagascarMalawiMalaysiaMaldivesMaliMaltaMarshall IslandsMauritaniaMauritiusMexicoMicronesia, Fed. Sts.MoldovaMonacoMongoliaMontenegroMoroccoMozambiqueMyanmarNamibiaNepalNetherlandsNew CaledoniaNew ZealandNicaraguaNigerNigeriaNorwayOmanPakistanPalauPanamaPapua New GuineaParaguayPeruPhilippinesPolandPortugalPuerto RicoQatarRomaniaRussian FederationRwandaSamoaSao Tome and PrincipeSaudi ArabiaSenegalSerbiaSeychellesSierra LeoneSingaporeSlovak RepublicSloveniaSolomon IslandsSomaliaSouth AfricaSouth SudanSpainSri LankaSt. Kitts and NevisSt. LuciaSt. Vincent and the GrenadinesSudanSurinameSwazilandSwedenSwitzerlandSyrian Arab RepublicTajikistanTanzaniaThailandTimor-LesteTogoTongaTrinidad and TobagoTunisiaTurkeyTurkmenistanTuvaluUgandaUkraineUnited Arab EmiratesUnited KingdomUnited StatesUruguayUzbekistanVanuatuVenezuela, RBVietnamVirgin Islands (U.S.)West Bank and GazaYemen, Rep.ZambiaZimbabwe

La ligne de temps

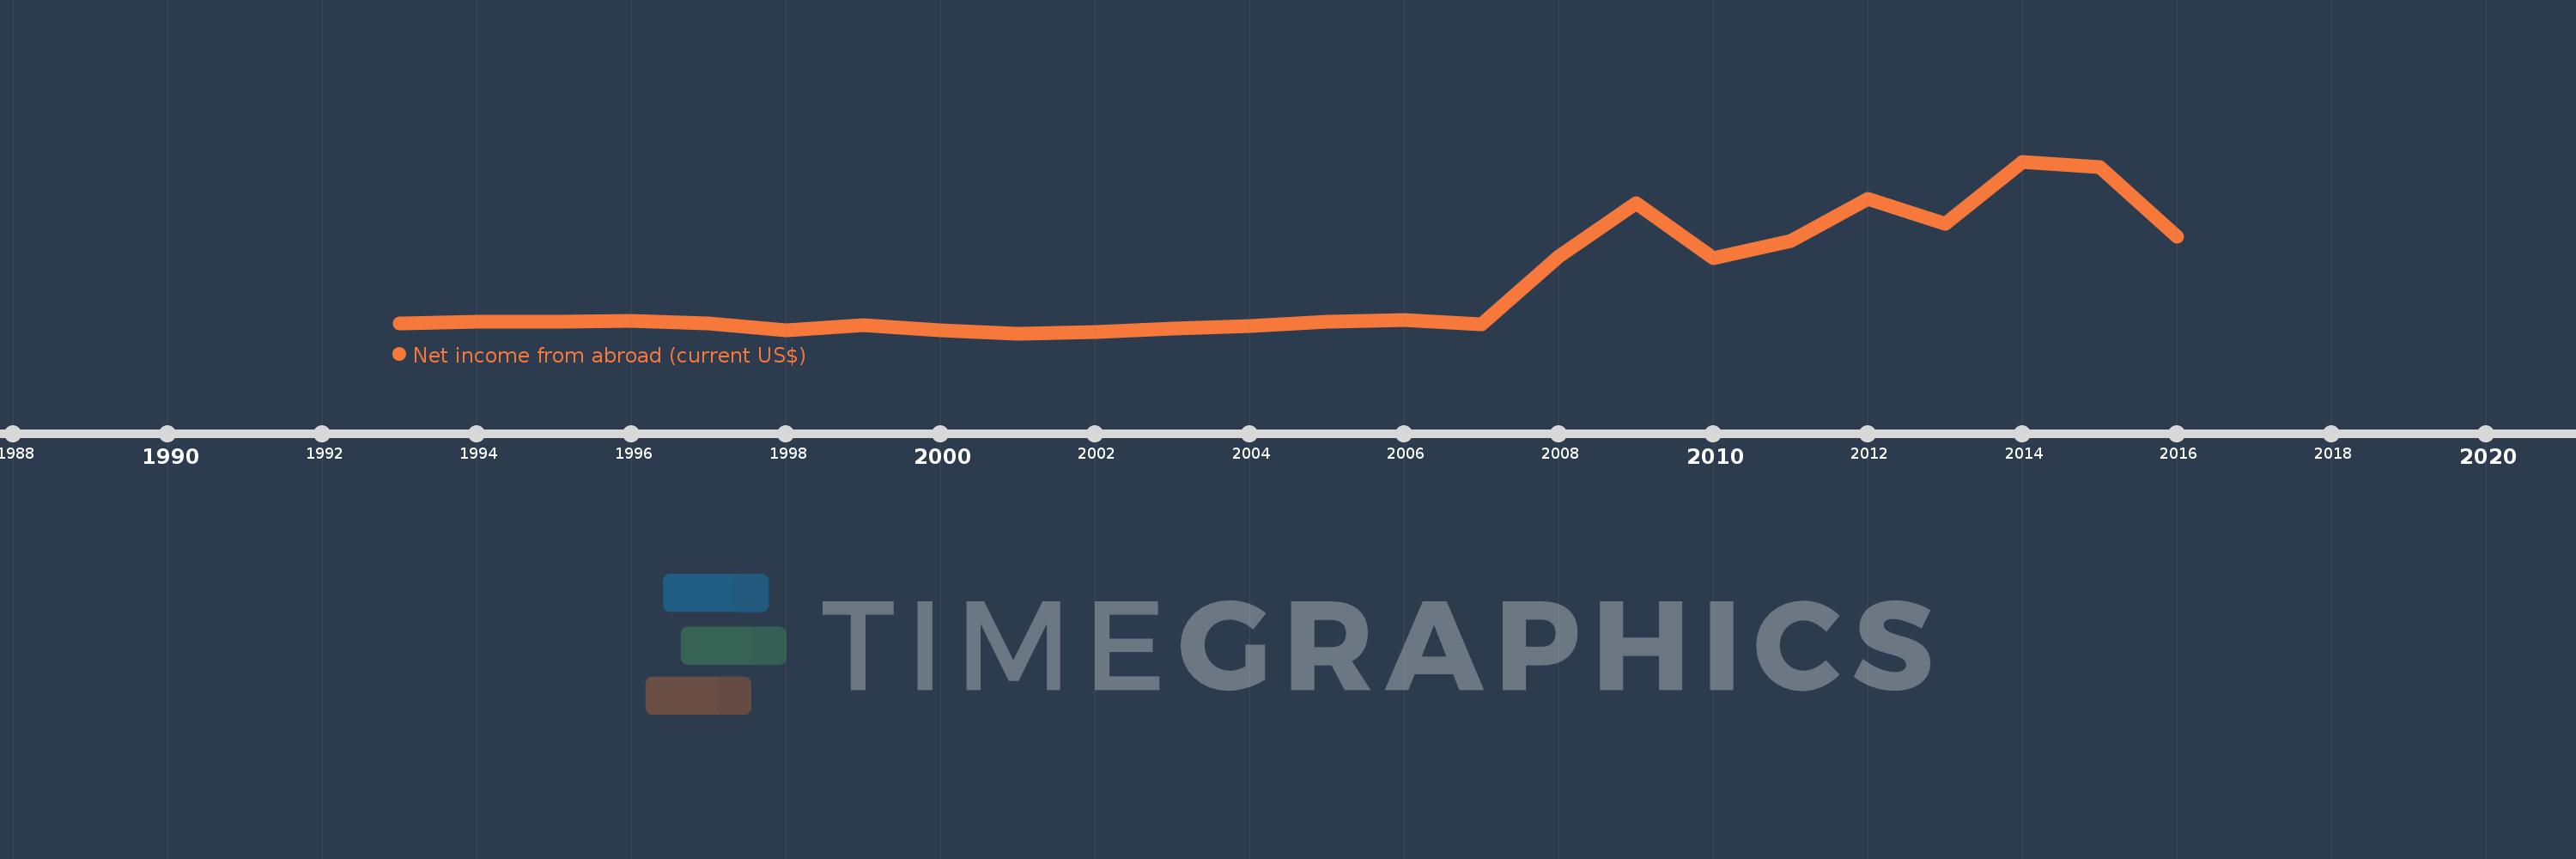
Cette échelle de temps montre un graphique de 1993 année à 2016 année Uzbekistan. Les données jusqu'à 1992 année ne sont pas présentés. Quantité d'observations actuelles selon dates: 24.

Source (désignation):

Les indicateurs du développement mondiale

Source (organisation):

World Bank national accounts data, and OECD National Accounts data files.

Catégories:

Economy & Growth

Dernière mise à jour

23 avr. 2017

Les indicateurs de changement de valeurs selon les années

En moyenne:
506.654 mln.
Minimum:
-219.0 mln.
1 janv. 2001
Maximum:
2.341 mds
1 janv. 2014
Pour la date d''observation
Valeur
Changement absolu
Le changement par rapport à la valeur précédente
1 janv. 1993
-71.195 mln.
-71.195 mln.
0.0%
1 janv. 1994
-48.681 mln.
+22.515 mln.
-31.62%
1 janv. 1995
-43.085 mln.
+5.596 mln.
-11.49%
1 janv. 1996
-34.128 mln.
+8.957 mln.
-20.79%
1 janv. 1997
-73.0 mln.
-38.872 mln.
113.9%
1 janv. 1998
-175.0 mln.
-102.0 mln.
139.73%
1 janv. 1999
-101.0 mln.
+74.0 mln.
-42.29%
1 janv. 2000
-168.0 mln.
-67.0 mln.
66.34%
1 janv. 2001
-219.0 mln.
-51.0 mln.
30.36%
1 janv. 2002
-205.0 mln.
+14.0 mln.
-6.39%
1 janv. 2003
-145.0 mln.
+60.0 mln.
-29.27%
1 janv. 2004
-116.0 mln.
+29.0 mln.
-20.0%
1 janv. 2005
-49.1 mln.
+66.9 mln.
-57.67%
1 janv. 2006
-24.3 mln.
+24.8 mln.
-50.51%
1 janv. 2007
-89.0 mln.
-64.7 mln.
266.26%
1 janv. 2008
931.0 mln.
+1.02 mds
-1.15 milles%
1 janv. 2009
1.722 mds
+791.018 mln.
84.96%
1 janv. 2010
897.0 mln.
-825.018 mln.
-47.91%
1 janv. 2011
1.159 mds
+262.0 mln.
29.21%
1 janv. 2012
1.779 mds
+620.3 mln.
53.52%
1 janv. 2013
1.413 mds
-366.33 mln.
-20.59%
1 janv. 2014
2.341 mds
+928.03 mln.
65.68%
1 janv. 2015
2.253 mds
-88.1 mln.
-3.76%
1 janv. 2016
1.226 mds
-1.027 mds
-45.58%

Classement des pays selon les statistiques actuelles par années