29
/fr/
fr
AIzaSyAYiBZKx7MnpbEhh9jyipgxe19OcubqV5w
April 1, 2024
192431
Marshall Islands
MHL
true
2
1
Net income from abroad (current US$)
2016,2015,2014,2013,2012,2011,2010,2009,2008,2007,2006,2005,2004,2003,2002,2001,2000,1999,1998,1997,1996
Download
Bibliothèque de statistiques globales →Marshall Islands →

Net income from abroad (current US$)

Cette statistique dans les autres pays:
AfghanistanAlbaniaAlgeriaAndorraAngolaAntigua and BarbudaArgentinaArmeniaAustraliaAustriaAzerbaijanBahamas, TheBahrainBangladeshBarbadosBelarusBelgiumBelizeBeninBermudaBhutanBoliviaBosnia and HerzegovinaBotswanaBrazilBrunei DarussalamBulgariaBurkina FasoBurundiCabo VerdeCambodiaCameroonCanadaCentral African RepublicChadChannel IslandsChileChinaColombiaComorosCongo, Dem. Rep.Congo, Rep.Costa RicaCote d'IvoireCroatiaCubaCyprusCzech RepublicDenmarkDjiboutiDominicaDominican RepublicEcuadorEgypt, Arab Rep.El SalvadorEquatorial GuineaEritreaEstoniaEthiopiaFaroe IslandsFijiFinlandFranceFrench PolynesiaGabonGambia, TheGeorgiaGermanyGhanaGreeceGreenlandGrenadaGuatemalaGuineaGuinea-BissauGuyanaHaitiHondurasHong Kong SAR, ChinaHungaryIcelandIndiaIndonesiaIran, Islamic Rep.IraqIrelandIsraelItalyJamaicaJapanJordanKazakhstanKenyaKiribatiKorea, Rep.KosovoKuwaitKyrgyz RepublicLao PDRLatviaLebanonLesothoLiberiaLibyaLithuaniaLuxembourgMacao SAR, ChinaMacedonia, FYRMadagascarMalawiMalaysiaMaldivesMaliMaltaMarshall IslandsMauritaniaMauritiusMexicoMicronesia, Fed. Sts.MoldovaMonacoMongoliaMontenegroMoroccoMozambiqueMyanmarNamibiaNepalNetherlandsNew CaledoniaNew ZealandNicaraguaNigerNigeriaNorwayOmanPakistanPalauPanamaPapua New GuineaParaguayPeruPhilippinesPolandPortugalPuerto RicoQatarRomaniaRussian FederationRwandaSamoaSao Tome and PrincipeSaudi ArabiaSenegalSerbiaSeychellesSierra LeoneSingaporeSlovak RepublicSloveniaSolomon IslandsSomaliaSouth AfricaSouth SudanSpainSri LankaSt. Kitts and NevisSt. LuciaSt. Vincent and the GrenadinesSudanSurinameSwazilandSwedenSwitzerlandSyrian Arab RepublicTajikistanTanzaniaThailandTimor-LesteTogoTongaTrinidad and TobagoTunisiaTurkeyTurkmenistanTuvaluUgandaUkraineUnited Arab EmiratesUnited KingdomUnited StatesUruguayUzbekistanVanuatuVenezuela, RBVietnamVirgin Islands (U.S.)West Bank and GazaYemen, Rep.ZambiaZimbabwe
La ligne de temps
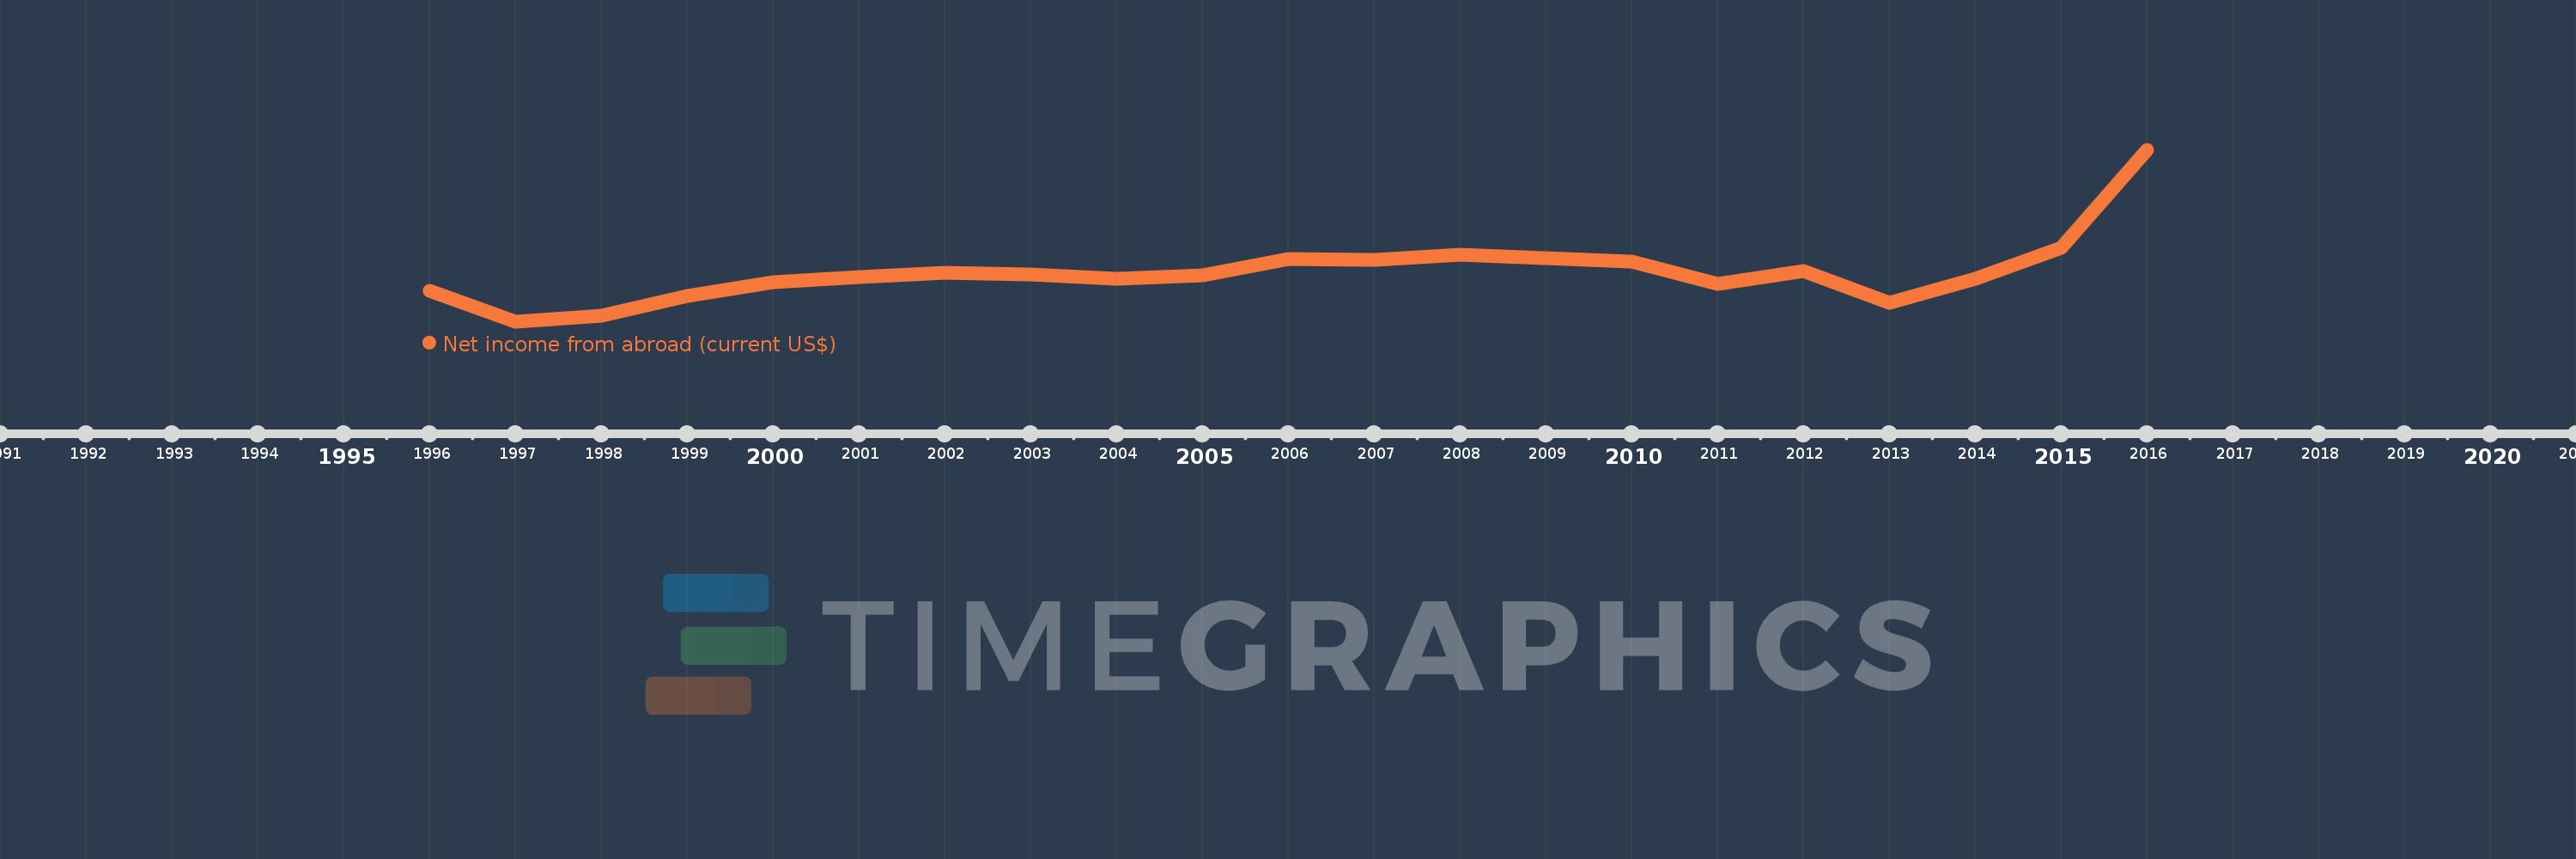
Cette échelle de temps montre un graphique de 1996 année à 2016 année Marshall Islands. Les données jusqu'à 1995 année ne sont pas présentés. Quantité d'observations actuelles selon dates: 21.
Source (désignation):
Les indicateurs du développement mondiale
Source (organisation):
World Bank national accounts data, and OECD National Accounts data files.
Catégories:
Economy & Growth
Dernière mise à jour
23 avr. 2017
Les indicateurs de changement de valeurs selon les années
En moyenne:
37.536 mln.
Minimum:
24.392 mln.
1 janv. 1997
Maximum:
69.6 mln.
1 janv. 2016
Pour la date d''observation
Valeur
Changement absolu
Le changement par rapport à la valeur précédente
1 janv. 1996
32.624 mln.
+32.624 mln.
0.0%
1 janv. 1997
24.392 mln.
-8.232 mln.
-25.23%
1 janv. 1998
26.004 mln.
+1.611 mln.
6.61%
1 janv. 1999
31.293 mln.
+5.29 mln.
20.34%
1 janv. 2000
34.903 mln.
+3.61 mln.
11.54%
1 janv. 2001
36.264 mln.
+1.361 mln.
3.9%
1 janv. 2002
37.439 mln.
+1.175 mln.
3.24%
1 janv. 2003
36.787 mln.
-652.0 milles
-1.74%
1 janv. 2004
35.791 mln.
-995.7 milles
-2.71%
1 janv. 2005
36.632 mln.
+841.1 milles
2.35%
1 janv. 2006
41.046 mln.
+4.414 mln.
12.05%
1 janv. 2007
40.704 mln.
-342.3 milles
-0.83%
1 janv. 2008
42.144 mln.
+1.441 mln.
3.54%
1 janv. 2009
41.173 mln.
-971.7 milles
-2.31%
1 janv. 2010
40.171 mln.
-1.002 mln.
-2.43%
1 janv. 2011
34.326 mln.
-5.845 mln.
-14.55%
1 janv. 2012
37.804 mln.
+3.478 mln.
10.13%
1 janv. 2013
29.399 mln.
-8.405 mln.
-22.23%
1 janv. 2014
35.817 mln.
+6.418 mln.
21.83%
1 janv. 2015
43.948 mln.
+8.131 mln.
22.7%
1 janv. 2016
69.6 mln.
+25.652 mln.
58.37%
Classement des pays selon les statistiques actuelles par années

Commentaires:

Envoyer
PremiumAbout & FeedbackUn accordConfidentialité
logo
© 2022 Selected Technologies LLC – Morgan Hill, California