29
/fr/
fr
AIzaSyAYiBZKx7MnpbEhh9jyipgxe19OcubqV5w
April 1, 2024
278245
Uruguay
URY
true
2
1
School enrollment, tertiary (gross), gender parity index (GPI)
2011,2010,2009,2008,2007,2006,2005,2004,2003,2002,2001,2000,1999,1984,1983,1981,1980,1978,1976,1975
Download
Bibliothèque de statistiques globales →Uruguay →

School enrollment, tertiary (gross), gender parity index (GPI)

Cette statistique dans les autres pays:
AfghanistanAlbaniaAlgeriaAngolaAntigua and BarbudaArab WorldArgentinaArmeniaArubaAustraliaAustriaAzerbaijanBahamas, TheBahrainBangladeshBarbadosBelarusBelgiumBelizeBeninBermudaBhutanBoliviaBosnia and HerzegovinaBotswanaBrazilBrunei DarussalamBulgariaBurkina FasoBurundiCabo VerdeCambodiaCameroonCanadaCaribbean small statesCentral African RepublicCentral Europe and the BalticsChadChileChinaColombiaComorosCongo, Dem. Rep.Congo, Rep.Costa RicaCote d'IvoireCroatiaCubaCuracaoCyprusCzech RepublicDenmarkDjiboutiDominicaDominican RepublicEarly-demographic dividendEast Asia & PacificEast Asia & Pacific (excluding high income)East Asia & Pacific (IDA & IBRD countries)EcuadorEgypt, Arab Rep.El SalvadorEquatorial GuineaEritreaEstoniaEthiopiaEuro areaEurope & Central AsiaEurope & Central Asia (excluding high income)Europe & Central Asia (IDA & IBRD countries)European UnionFijiFinlandFragile and conflict affected situationsFranceGabonGambia, TheGeorgiaGermanyGhanaGreeceGrenadaGuatemalaGuineaGuinea-BissauGuyanaHaitiHeavily indebted poor countries (HIPC)High incomeHondurasHong Kong SAR, ChinaHungaryIBRD onlyIcelandIDA & IBRD totalIDA blendIDA onlyIDA totalIndiaIndonesiaIran, Islamic Rep.IraqIrelandIsraelItalyJamaicaJapanJordanKazakhstanKenyaKorea, Dem. People’s Rep.Korea, Rep.KuwaitKyrgyz RepublicLao PDRLate-demographic dividendLatin America & Caribbean Latin America & Caribbean (excluding high income)Latin America & the Caribbean (IDA & IBRD countries)LatviaLeast developed countries: UN classificationLebanonLesothoLiberiaLibyaLiechtensteinLithuaniaLow & middle incomeLow incomeLower middle incomeLuxembourgMacao SAR, ChinaMacedonia, FYRMadagascarMalawiMaldivesMaliMaltaMarshall IslandsMauritaniaMauritiusMexicoMicronesia, Fed. Sts.Middle East & North AfricaMiddle East & North Africa (excluding high income)Middle East & North Africa (IDA & IBRD countries)Middle incomeMoldovaMongoliaMontenegroMoroccoMozambiqueMyanmarNamibiaNepalNetherlandsNew ZealandNicaraguaNigerNigeriaNorth AmericaNorwayOECD membersOmanOther small statesPacific island small statesPakistanPalauPanamaPapua New GuineaParaguayPeruPhilippinesPolandPortugalPost-demographic dividendPre-demographic dividendPuerto RicoQatarRomaniaRussian FederationRwandaSamoaSan MarinoSao Tome and PrincipeSaudi ArabiaSenegalSerbiaSeychellesSierra LeoneSingaporeSlovak RepublicSloveniaSmall statesSomaliaSouth AfricaSouth AsiaSouth Asia (IDA & IBRD)SpainSri LankaSt. Kitts and NevisSt. LuciaSt. Vincent and the GrenadinesSub-Saharan Africa Sub-Saharan Africa (excluding high income)Sub-Saharan Africa (IDA & IBRD countries)SudanSurinameSwazilandSwedenSwitzerlandSyrian Arab RepublicTajikistanTanzaniaThailandTimor-LesteTogoTongaTrinidad and TobagoTunisiaTurkeyTurkmenistanUgandaUkraineUnited Arab EmiratesUnited KingdomUnited StatesUpper middle incomeUruguayUzbekistanVanuatuVenezuela, RBVietnamWest Bank and GazaWorldYemen, Rep.ZambiaZimbabwe
La ligne de temps
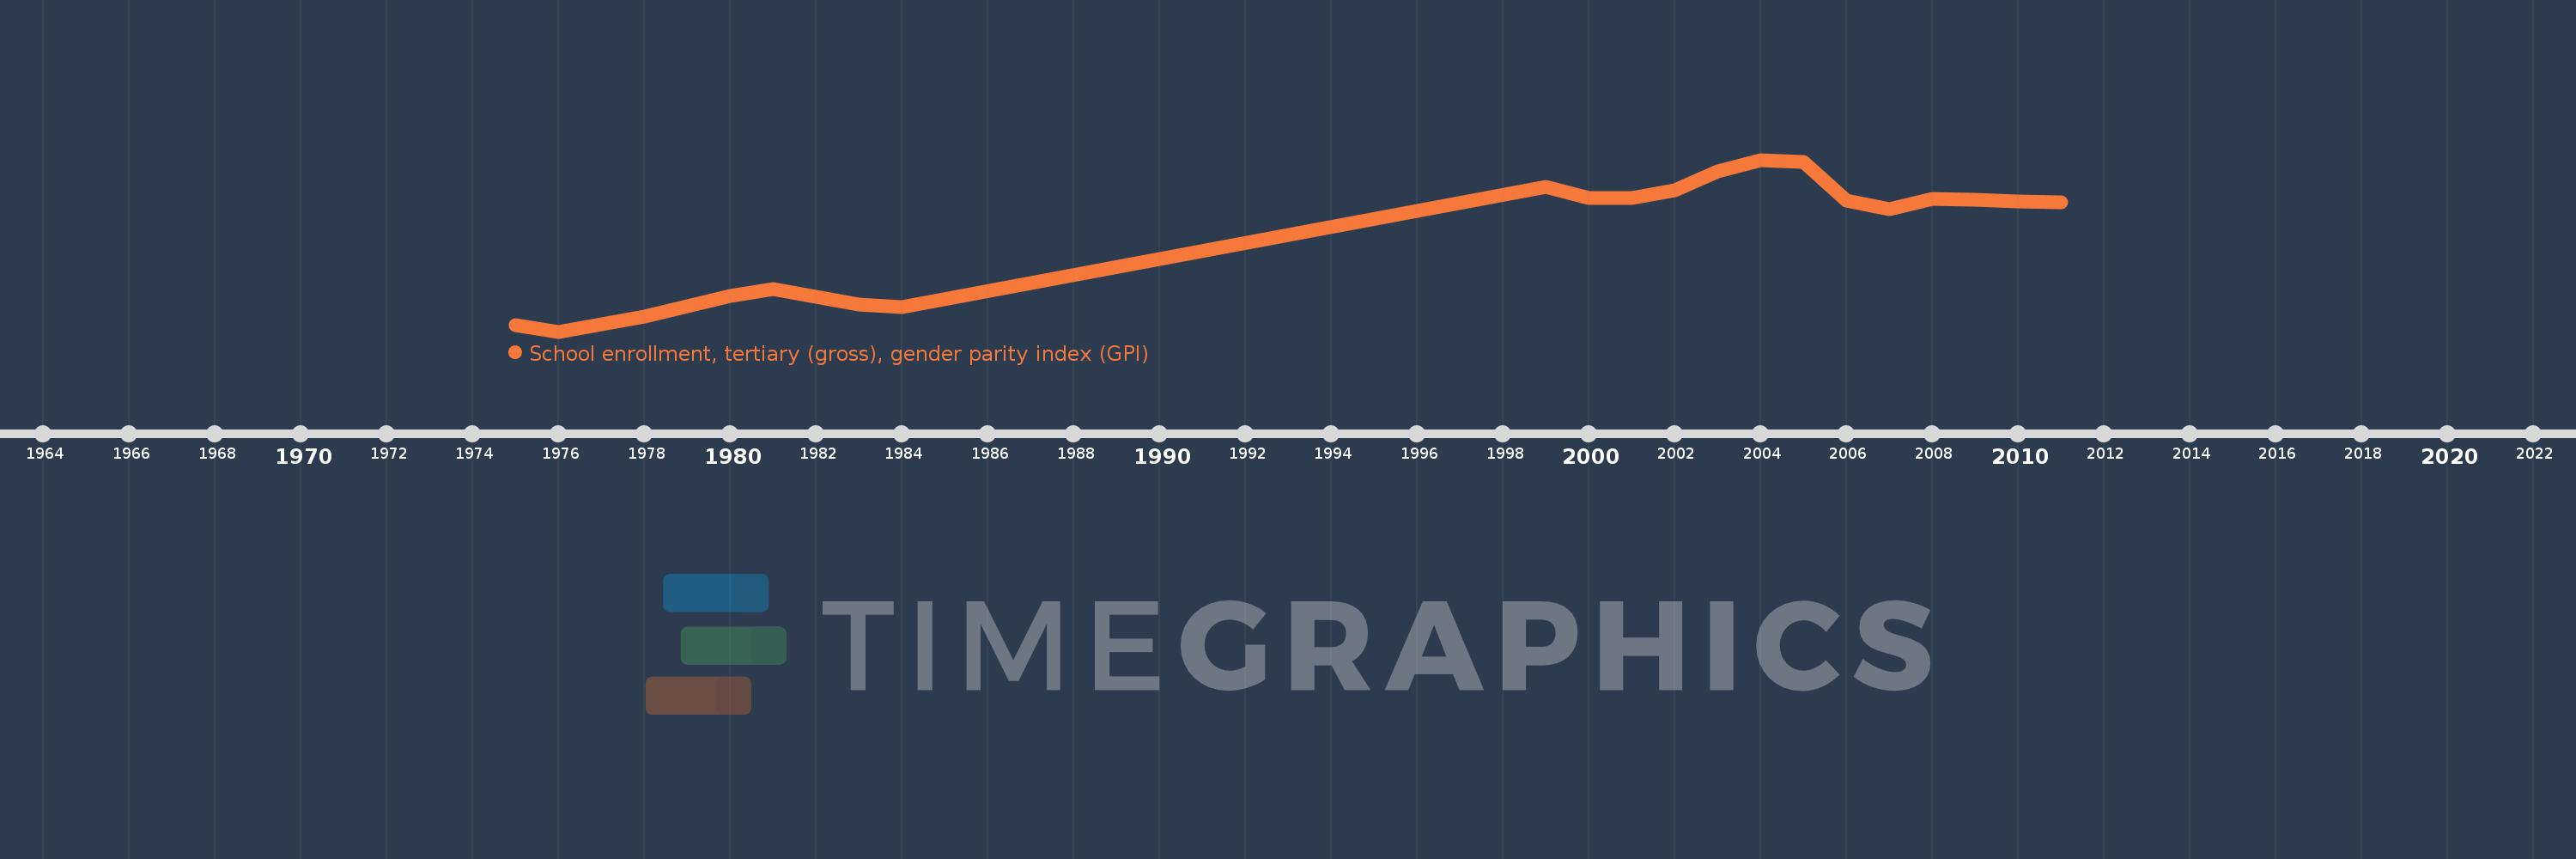
Cette échelle de temps montre un graphique de 1975 année à 2011 année Uruguay. Les données jusqu'à 1974 année ne sont pas présentés. Quantité d'observations actuelles selon dates: 20.
Source (désignation):
Les indicateurs du développement mondiale
Source (organisation):
United Nations Educational, Scientific, and Cultural Organization (UNESCO) Institute for Statistics.
Catégories:
Education, Gender, Social Development
Dernière mise à jour
23 avr. 2017
Les indicateurs de changement de valeurs selon les années
En moyenne:
1.513
Minimum:
0.806
1 janv. 1976
Maximum:
2.031
1 janv. 2004
Pour la date d''observation
Valeur
Changement absolu
Le changement par rapport à la valeur précédente
1 janv. 1975
0.852
+0.852
0.0%
1 janv. 1976
0.806
-0.047
-5.46%
1 janv. 1978
0.913
+0.107
13.28%
1 janv. 1980
1.063
+0.15
16.45%
1 janv. 1981
1.112
+0.05
4.66%
1 janv. 1983
1.002
-0.111
-9.96%
1 janv. 1984
0.981
-0.021
-2.12%
1 janv. 1999
1.837
+0.856
87.35%
1 janv. 2000
1.758
-0.079
-4.3%
1 janv. 2001
1.759
+0.001
0.05%
1 janv. 2002
1.814
+0.055
3.12%
1 janv. 2003
1.946
+0.132
7.27%
1 janv. 2004
2.031
+0.085
4.39%
1 janv. 2005
2.016
-0.015
-0.75%
1 janv. 2006
1.743
-0.272
-13.51%
1 janv. 2007
1.679
-0.064
-3.67%
1 janv. 2008
1.751
+0.072
4.26%
1 janv. 2009
1.744
-0.007
-0.42%
1 janv. 2010
1.736
-0.008
-0.45%
1 janv. 2011
1.726
-0.01
-0.55%
Classement des pays selon les statistiques actuelles par années

Commentaires:

Envoyer
PremiumAbout & FeedbackUn accordConfidentialité
logo
© 2022 Selected Technologies LLC – Morgan Hill, California