33
/fr/
AIzaSyB4mHJ5NPEv-XzF7P6NDYXjlkCWaeKw5bc
November 1, 2025
273451
Ukraine
UKR
true
2
1
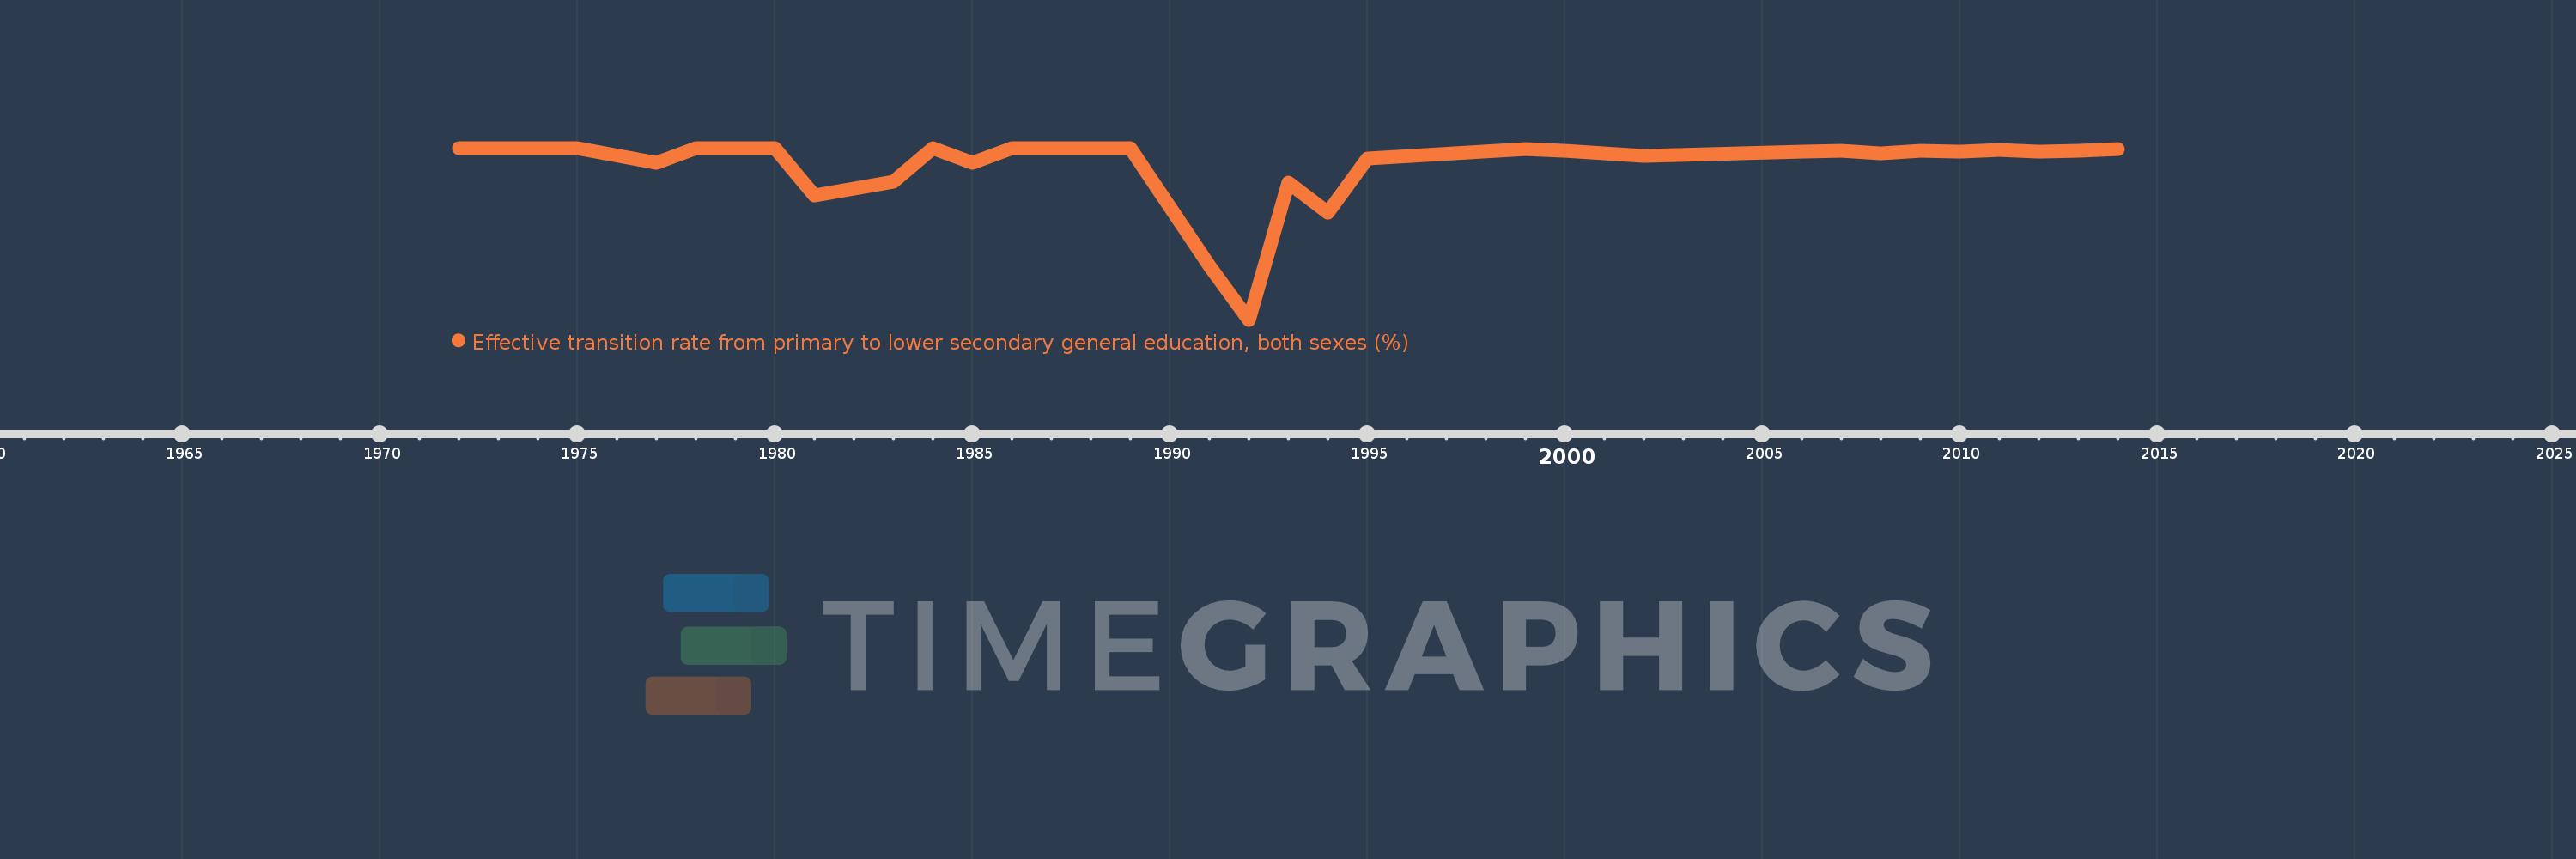
Effective transition rate from primary to lower secondary general education, both sexes (%)
2014,2013,2012,2011,2010,2009,2008,2007,2006,2002,2000,1999,1995,1994,1993,1992,1991,1989,1986,1985,1984,1983,1981,1980,1979,1978,1977,1975,1974,1973,1972