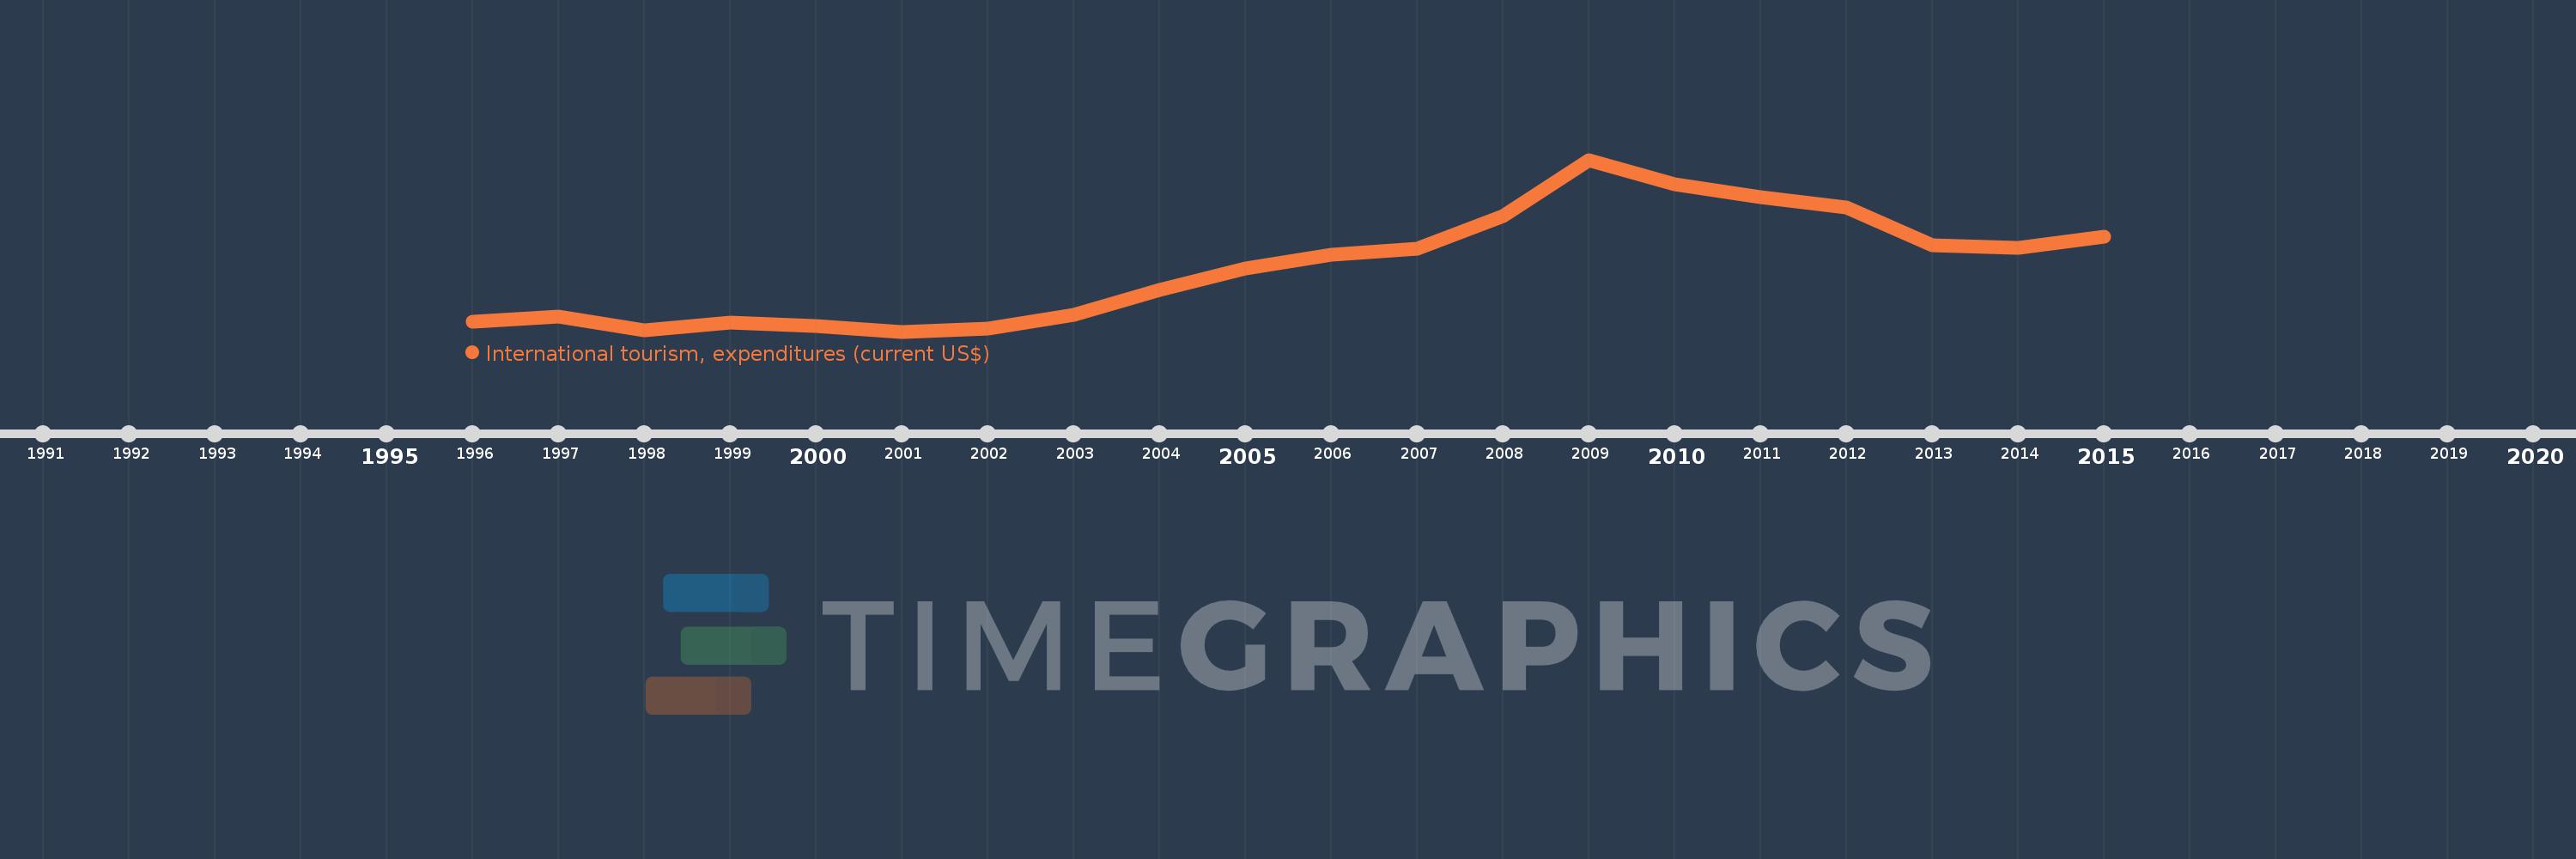
Cette échelle de temps montre un graphique de 1996 année à 2015 année Slovenia. Les données jusqu'à 1995 année ne sont pas présentés. Quantité d'observations actuelles selon dates: 20.
Source (désignation):
Les indicateurs du développement mondiale
Source (organisation):
World Tourism Organization, Yearbook of Tourism Statistics, Compendium of Tourism Statistics and data files.
Catégories:
Private Sector, Trade
Dernière mise à jour
23 avr. 2017
Les indicateurs de changement de valeurs selon les années
En moyenne:
942.2 mln.
Minimum:
544.0 mln.
1 janv. 2001
Maximum:
1.61 mds
1 janv. 2009
Pour la date d''observation
Valeur
Changement absolu
Le changement par rapport à la valeur précédente
1 janv. 1996
606.0 mln.
+606.0 mln.
0.0%
1 janv. 1997
638.0 mln.
+32.0 mln.
5.28%
1 janv. 1998
554.0 mln.
-84.0 mln.
-13.17%
1 janv. 1999
601.0 mln.
+47.0 mln.
8.48%
1 janv. 2000
579.0 mln.
-22.0 mln.
-3.66%
1 janv. 2001
544.0 mln.
-35.0 mln.
-6.04%
1 janv. 2002
560.0 mln.
+16.0 mln.
2.94%
1 janv. 2003
647.0 mln.
+87.0 mln.
15.54%
1 janv. 2004
805.0 mln.
+158.0 mln.
24.42%
1 janv. 2005
937.0 mln.
+132.0 mln.
16.4%
1 janv. 2006
1.019 mds
+82.0 mln.
8.75%
1 janv. 2007
1.058 mds
+39.0 mln.
3.83%
1 janv. 2008
1.261 mds
+203.0 mln.
19.19%
1 janv. 2009
1.61 mds
+349.0 mln.
27.68%
1 janv. 2010
1.456 mds
-154.0 mln.
-9.57%
1 janv. 2011
1.377 mds
-79.0 mln.
-5.43%
1 janv. 2012
1.315 mds
-62.0 mln.
-4.5%
1 janv. 2013
1.081 mds
-234.0 mln.
-17.79%
1 janv. 2014
1.064 mds
-17.0 mln.
-1.57%
1 janv. 2015
1.132 mds
+68.0 mln.
6.39%
Classement des pays selon les statistiques actuelles par années