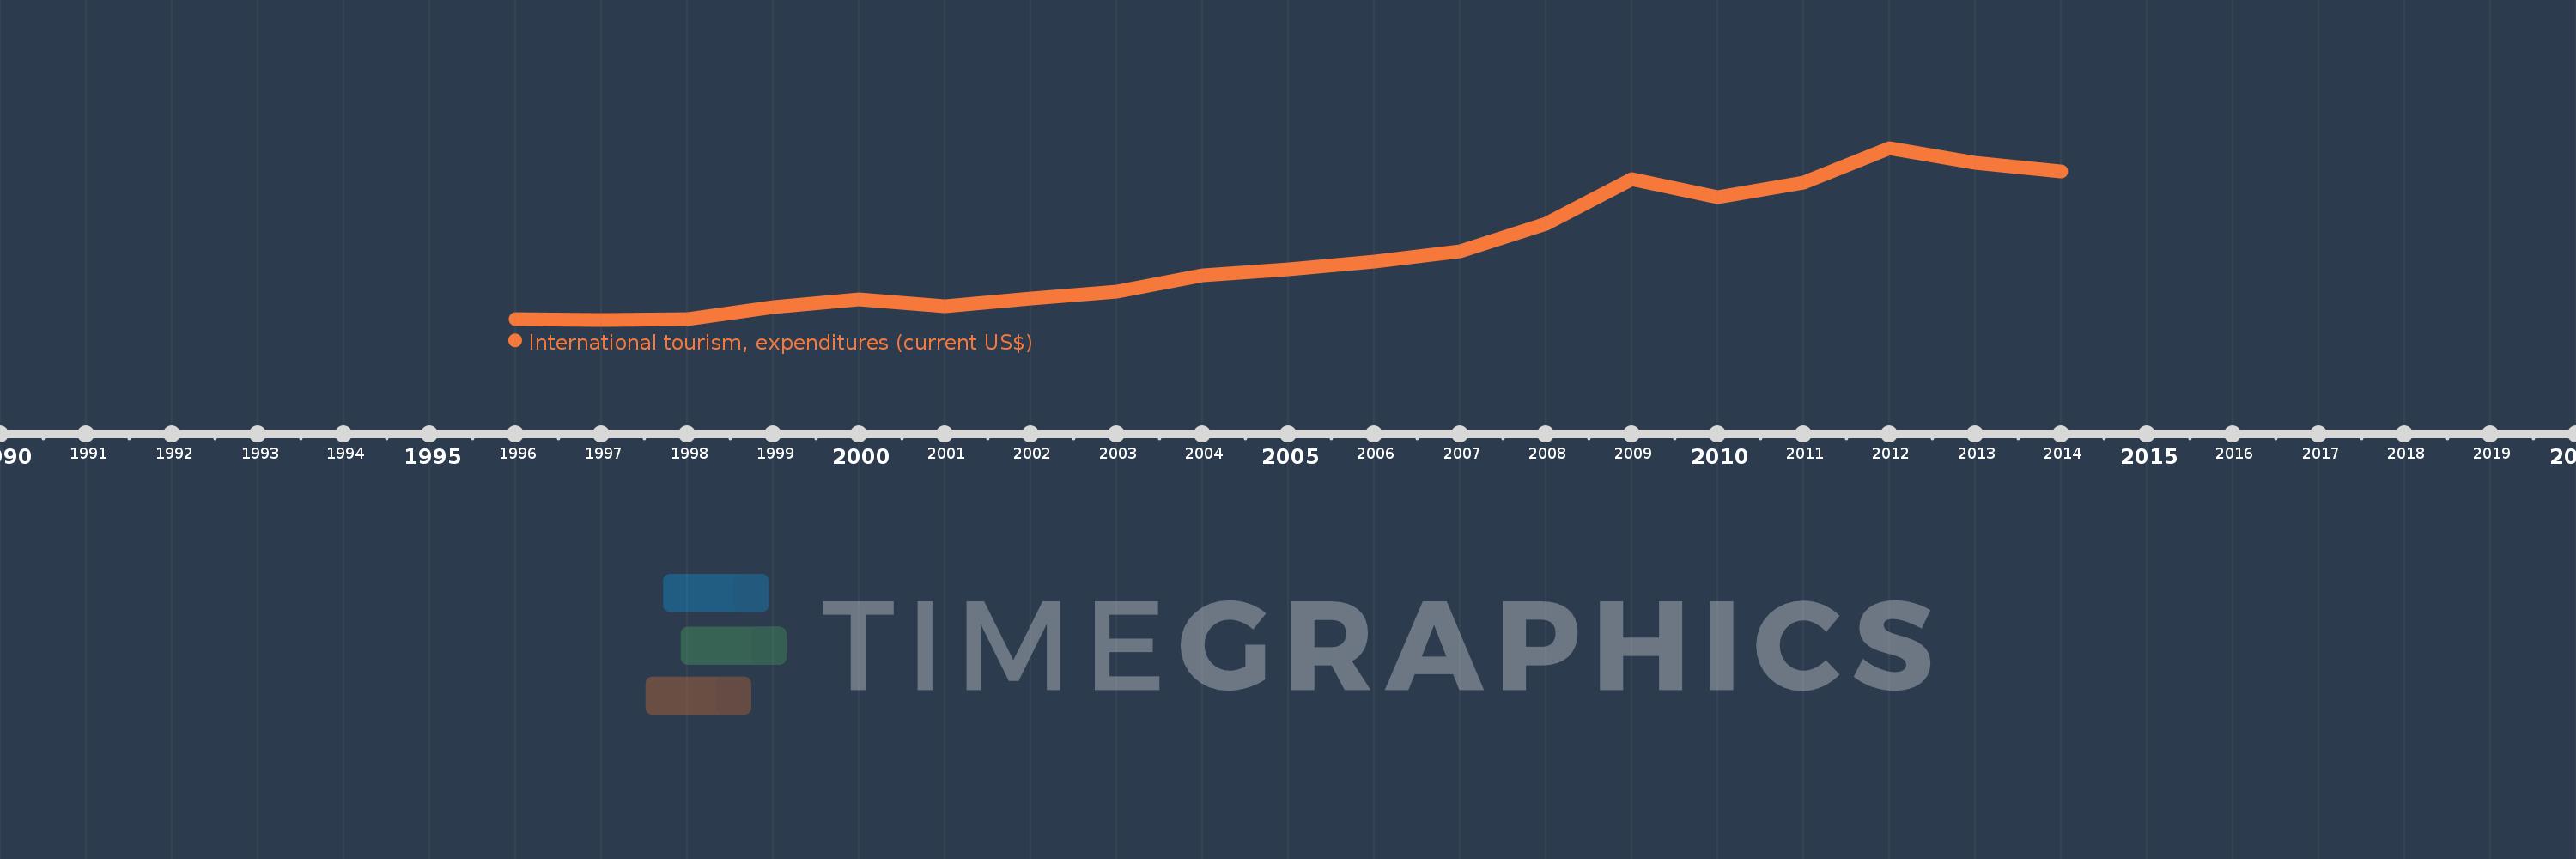
Cette échelle de temps montre un graphique de 1996 année à 2014 année Morocco. Les données jusqu'à 1995 année ne sont pas présentés. Quantité d'observations actuelles selon dates: 19.
Source (désignation):
Les indicateurs du développement mondiale
Source (organisation):
World Tourism Organization, Yearbook of Tourism Statistics, Compendium of Tourism Statistics and data files.
Catégories:
Private Sector, Trade
Dernière mise à jour
23 avr. 2017
Les indicateurs de changement de valeurs selon les années
En moyenne:
1.108 mds
Minimum:
353.0 mln.
1 janv. 1997
Maximum:
2.26 mds
1 janv. 2012
Pour la date d''observation
Valeur
Changement absolu
Le changement par rapport à la valeur précédente
1 janv. 1996
356.0 mln.
+356.0 mln.
0.0%
1 janv. 1997
353.0 mln.
-3.0 mln.
-0.84%
1 janv. 1998
363.0 mln.
+10.0 mln.
2.83%
1 janv. 1999
496.0 mln.
+133.0 mln.
36.64%
1 janv. 2000
578.0 mln.
+82.0 mln.
16.53%
1 janv. 2001
506.0 mln.
-72.0 mln.
-12.46%
1 janv. 2002
589.0 mln.
+83.0 mln.
16.4%
1 janv. 2003
669.0 mln.
+80.0 mln.
13.58%
1 janv. 2004
845.0 mln.
+176.0 mln.
26.31%
1 janv. 2005
912.0 mln.
+67.0 mln.
7.93%
1 janv. 2006
999.0 mln.
+87.0 mln.
9.54%
1 janv. 2007
1.113 mds
+114.0 mln.
11.41%
1 janv. 2008
1.418 mds
+305.0 mln.
27.4%
1 janv. 2009
1.91 mds
+492.0 mln.
34.7%
1 janv. 2010
1.713 mds
-197.0 mln.
-10.31%
1 janv. 2011
1.879 mds
+166.0 mln.
9.69%
1 janv. 2012
2.26 mds
+381.0 mln.
20.28%
1 janv. 2013
2.095 mds
-165.0 mln.
-7.3%
1 janv. 2014
2.002 mds
-93.0 mln.
-4.44%
Classement des pays selon les statistiques actuelles par années