29
/fr/
fr
AIzaSyAYiBZKx7MnpbEhh9jyipgxe19OcubqV5w
April 1, 2024
232427
Samoa
WSM
true
2
1
Manufacturing, value added (current LCU)
2016,2015,2014,2013,2012,2011,2010,2009,2008,2007,2006,2005,2004,2003,2002,2001,2000,1999,1998,1997,1996,1995
Download
Bibliothèque de statistiques globales →Samoa →

Manufacturing, value added (current LCU)

Cette statistique dans les autres pays:
AfghanistanAlbaniaAlgeriaAndorraAngolaAntigua and BarbudaArgentinaArmeniaArubaAustraliaAustriaAzerbaijanBahamas, TheBahrainBangladeshBarbadosBelarusBelgiumBelizeBeninBermudaBhutanBoliviaBosnia and HerzegovinaBotswanaBrazilBrunei DarussalamBurkina FasoBurundiCabo VerdeCambodiaCameroonCanadaCayman IslandsCentral African RepublicChadChileChinaColombiaComorosCongo, Dem. Rep.Congo, Rep.Costa RicaCote d'IvoireCroatiaCubaCyprusCzech RepublicDenmarkDjiboutiDominicaDominican RepublicEcuadorEgypt, Arab Rep.El SalvadorEquatorial GuineaEritreaEstoniaEthiopiaFaroe IslandsFijiFinlandFranceGabonGambia, TheGeorgiaGermanyGhanaGreeceGrenadaGuatemalaGuineaGuinea-BissauGuyanaHondurasHong Kong SAR, ChinaHungaryIcelandIndiaIndonesiaIran, Islamic Rep.IraqIrelandItalyJamaicaJapanJordanKazakhstanKenyaKiribatiKorea, Rep.KosovoKuwaitKyrgyz RepublicLao PDRLatviaLebanonLesothoLiberiaLibyaLithuaniaLuxembourgMacao SAR, ChinaMacedonia, FYRMadagascarMalawiMalaysiaMaldivesMaliMaltaMarshall IslandsMauritaniaMauritiusMexicoMicronesia, Fed. Sts.MoldovaMongoliaMontenegroMoroccoMozambiqueMyanmarNamibiaNepalNetherlandsNew CaledoniaNew ZealandNicaraguaNigerNigeriaNorwayOmanPakistanPalauPanamaPapua New GuineaParaguayPeruPhilippinesPolandPortugalPuerto RicoQatarRomaniaRussian FederationRwandaSamoaSao Tome and PrincipeSaudi ArabiaSenegalSerbiaSeychellesSierra LeoneSingaporeSlovak RepublicSloveniaSolomon IslandsSomaliaSouth AfricaSpainSri LankaSt. Kitts and NevisSt. LuciaSt. Vincent and the GrenadinesSudanSurinameSwazilandSwedenSwitzerlandSyrian Arab RepublicTajikistanTanzaniaThailandTimor-LesteTogoTongaTrinidad and TobagoTunisiaTurkeyTurkmenistanTuvaluUgandaUkraineUnited Arab EmiratesUnited KingdomUnited StatesUruguayUzbekistanVanuatuVenezuela, RBVietnamWest Bank and GazaYemen, Rep.ZambiaZimbabwe
La ligne de temps
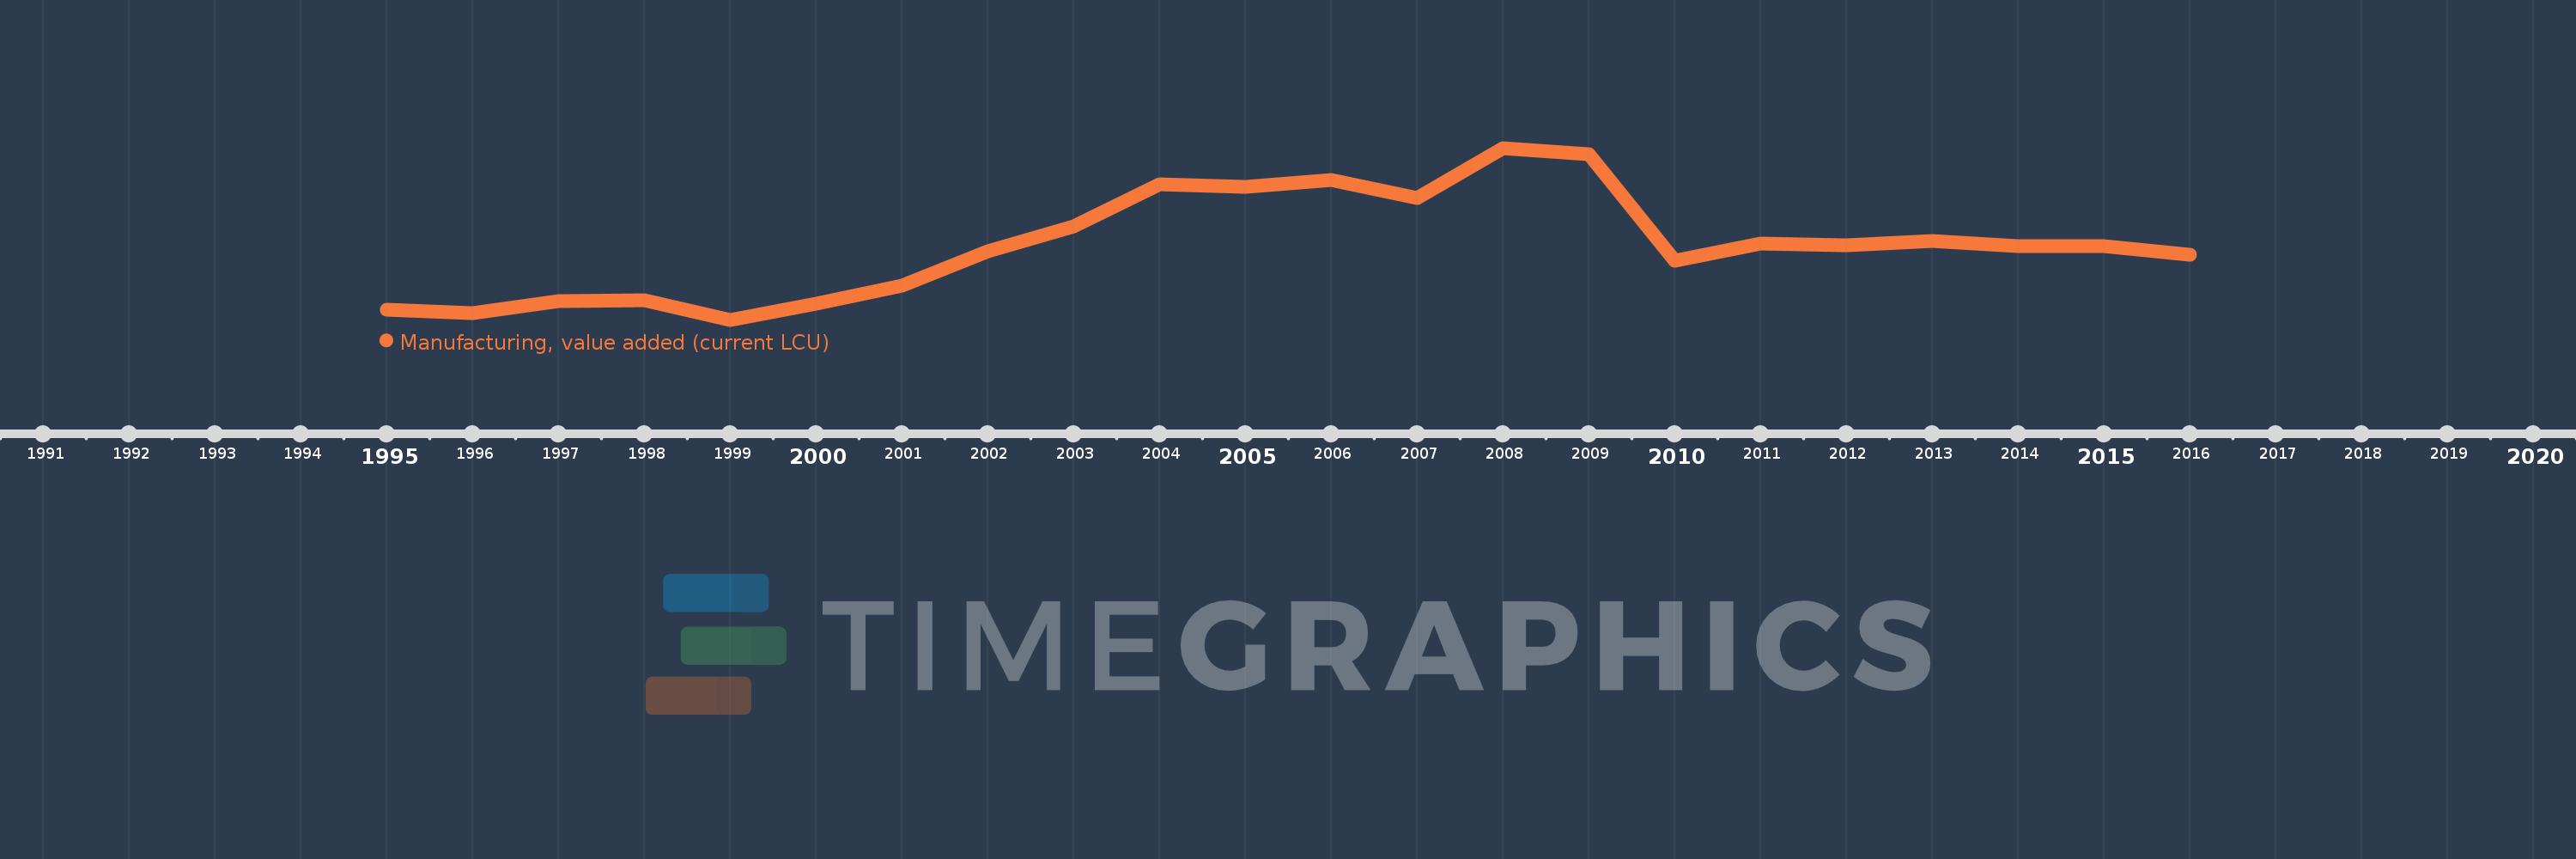
Cette échelle de temps montre un graphique de 1995 année à 2016 année Samoa. Les données jusqu'à 1994 année ne sont pas présentés. Quantité d'observations actuelles selon dates: 22.
Source (désignation):
Les indicateurs du développement mondiale
Source (organisation):
World Bank national accounts data, and OECD National Accounts data files.
Catégories:
Economy & Growth
Dernière mise à jour
23 avr. 2017
Les indicateurs de changement de valeurs selon les années
En moyenne:
198.716 mln.
Minimum:
133.15 mln.
1 janv. 1999
Maximum:
284.895 mln.
1 janv. 2008
Pour la date d''observation
Valeur
Changement absolu
Le changement par rapport à la valeur précédente
1 janv. 1995
142.046 mln.
+142.046 mln.
0.0%
1 janv. 1996
138.901 mln.
-3.145 mln.
-2.21%
1 janv. 1997
149.243 mln.
+10.342 mln.
7.45%
1 janv. 1998
150.62 mln.
+1.377 mln.
0.92%
1 janv. 1999
133.15 mln.
-17.47 mln.
-11.6%
1 janv. 2000
147.24 mln.
+14.09 mln.
10.58%
1 janv. 2001
163.078 mln.
+15.838 mln.
10.76%
1 janv. 2002
193.567 mln.
+30.489 mln.
18.7%
1 janv. 2003
215.676 mln.
+22.109 mln.
11.42%
1 janv. 2004
252.521 mln.
+36.845 mln.
17.08%
1 janv. 2005
250.591 mln.
-1.929 mln.
-0.76%
1 janv. 2006
256.312 mln.
+5.721 mln.
2.28%
1 janv. 2007
240.88 mln.
-15.432 mln.
-6.02%
1 janv. 2008
284.895 mln.
+44.015 mln.
18.27%
1 janv. 2009
279.361 mln.
-5.534 mln.
-1.94%
1 janv. 2010
185.6 mln.
-93.761 mln.
-33.56%
1 janv. 2011
200.219 mln.
+14.619 mln.
7.88%
1 janv. 2012
198.683 mln.
-1.536 mln.
-0.77%
1 janv. 2013
202.993 mln.
+4.31 mln.
2.17%
1 janv. 2014
197.846 mln.
-5.147 mln.
-2.54%
1 janv. 2015
197.835 mln.
-11.0 milles
-0.01%
1 janv. 2016
190.498 mln.
-7.337 mln.
-3.71%
Classement des pays selon les statistiques actuelles par années

Commentaires:

Envoyer
PremiumAbout & FeedbackUn accordConfidentialité
logo
© 2022 Selected Technologies LLC – Morgan Hill, California