29
/fr/
fr
AIzaSyAYiBZKx7MnpbEhh9jyipgxe19OcubqV5w
April 1, 2024
138295
Georgia
GEO
true
2
1
Manufacturing, value added (current LCU)
2016,2015,2014,2013,2012,2011,2010,2009,2008,2007,2006,2005,2004,2003,2002,2001,2000,1999,1998,1997
Download
Bibliothèque de statistiques globales →Georgia →

Manufacturing, value added (current LCU)

Cette statistique dans les autres pays:
AfghanistanAlbaniaAlgeriaAndorraAngolaAntigua and BarbudaArgentinaArmeniaArubaAustraliaAustriaAzerbaijanBahamas, TheBahrainBangladeshBarbadosBelarusBelgiumBelizeBeninBermudaBhutanBoliviaBosnia and HerzegovinaBotswanaBrazilBrunei DarussalamBurkina FasoBurundiCabo VerdeCambodiaCameroonCanadaCayman IslandsCentral African RepublicChadChileChinaColombiaComorosCongo, Dem. Rep.Congo, Rep.Costa RicaCote d'IvoireCroatiaCubaCyprusCzech RepublicDenmarkDjiboutiDominicaDominican RepublicEcuadorEgypt, Arab Rep.El SalvadorEquatorial GuineaEritreaEstoniaEthiopiaFaroe IslandsFijiFinlandFranceGabonGambia, TheGeorgiaGermanyGhanaGreeceGrenadaGuatemalaGuineaGuinea-BissauGuyanaHondurasHong Kong SAR, ChinaHungaryIcelandIndiaIndonesiaIran, Islamic Rep.IraqIrelandItalyJamaicaJapanJordanKazakhstanKenyaKiribatiKorea, Rep.KosovoKuwaitKyrgyz RepublicLao PDRLatviaLebanonLesothoLiberiaLibyaLithuaniaLuxembourgMacao SAR, ChinaMacedonia, FYRMadagascarMalawiMalaysiaMaldivesMaliMaltaMarshall IslandsMauritaniaMauritiusMexicoMicronesia, Fed. Sts.MoldovaMongoliaMontenegroMoroccoMozambiqueMyanmarNamibiaNepalNetherlandsNew CaledoniaNew ZealandNicaraguaNigerNigeriaNorwayOmanPakistanPalauPanamaPapua New GuineaParaguayPeruPhilippinesPolandPortugalPuerto RicoQatarRomaniaRussian FederationRwandaSamoaSao Tome and PrincipeSaudi ArabiaSenegalSerbiaSeychellesSierra LeoneSingaporeSlovak RepublicSloveniaSolomon IslandsSomaliaSouth AfricaSpainSri LankaSt. Kitts and NevisSt. LuciaSt. Vincent and the GrenadinesSudanSurinameSwazilandSwedenSwitzerlandSyrian Arab RepublicTajikistanTanzaniaThailandTimor-LesteTogoTongaTrinidad and TobagoTunisiaTurkeyTurkmenistanTuvaluUgandaUkraineUnited Arab EmiratesUnited KingdomUnited StatesUruguayUzbekistanVanuatuVenezuela, RBVietnamWest Bank and GazaYemen, Rep.ZambiaZimbabwe
La ligne de temps
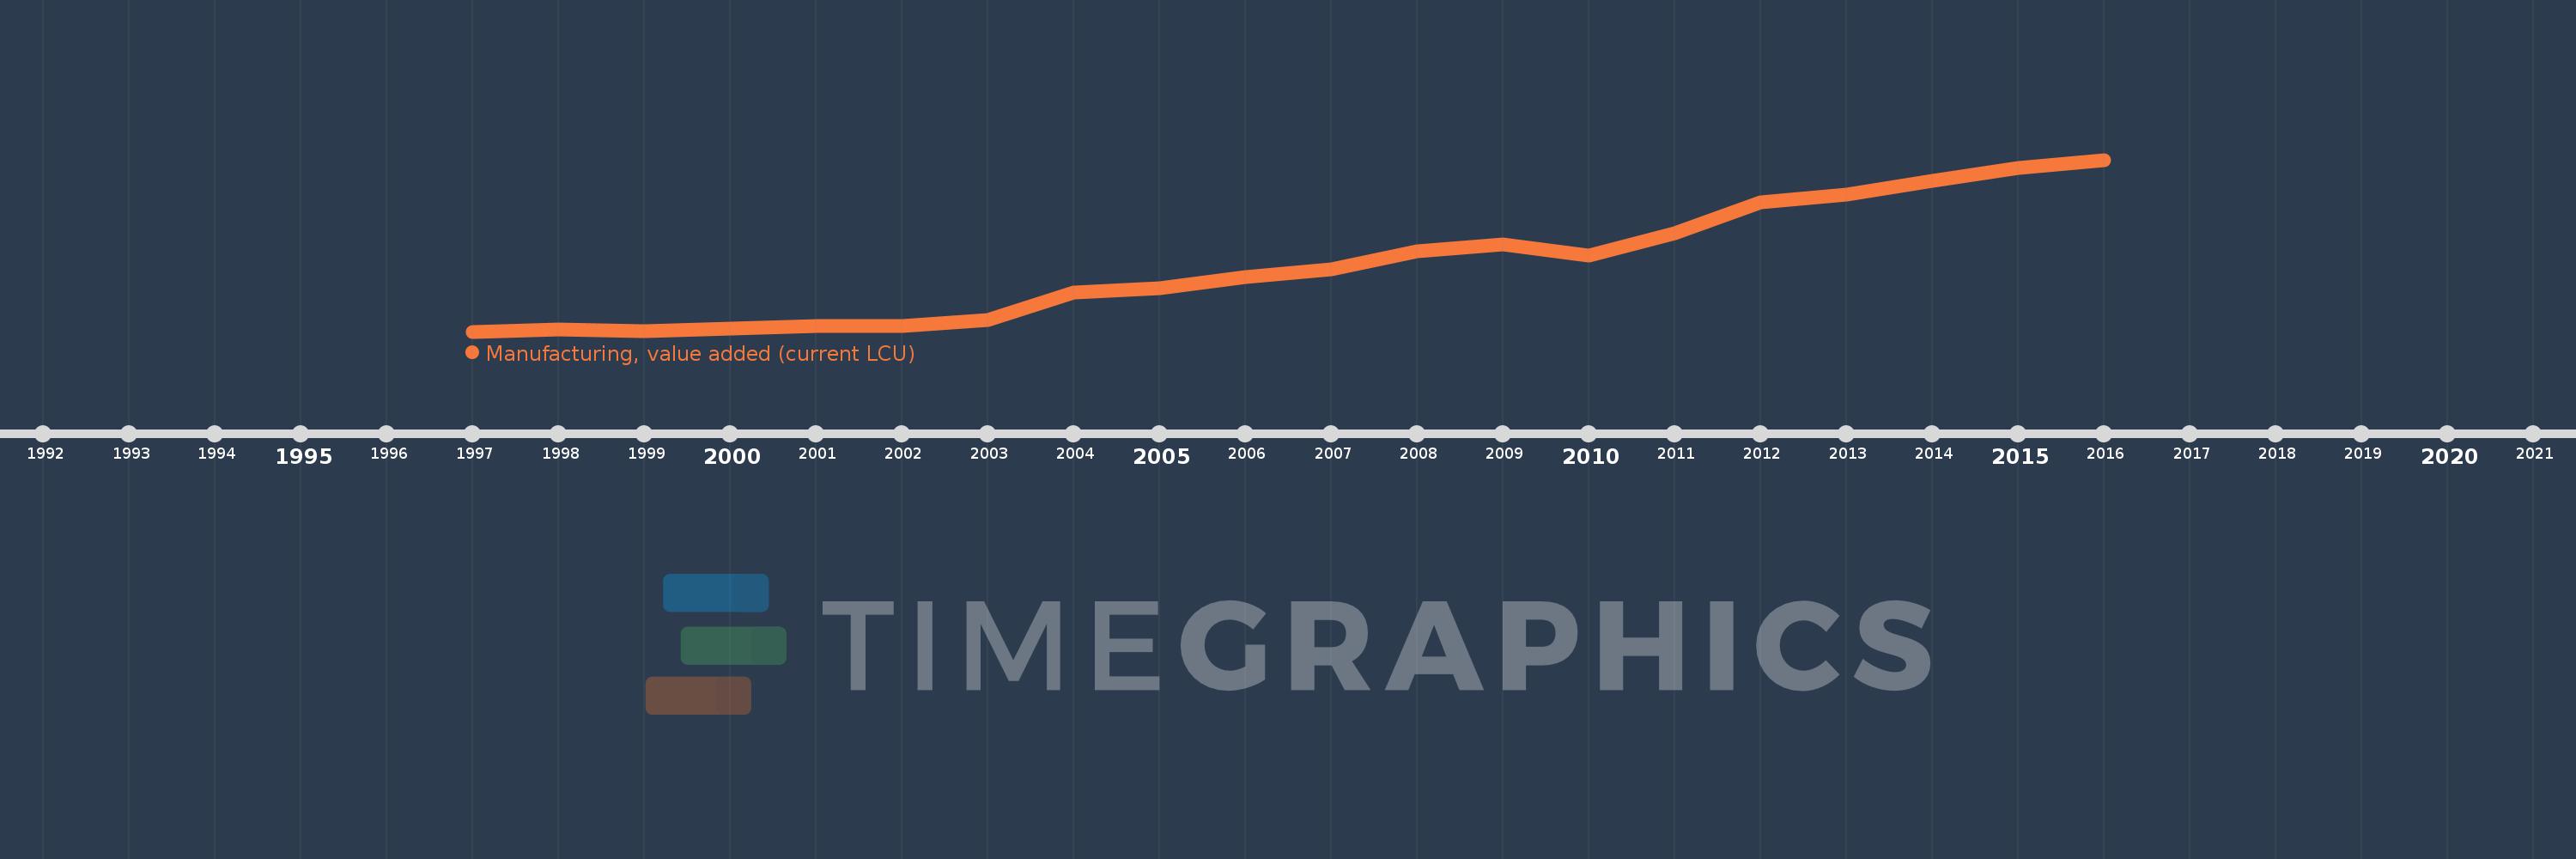
Cette échelle de temps montre un graphique de 1997 année à 2016 année Georgia. Les données jusqu'à 1996 année ne sont pas présentés. Quantité d'observations actuelles selon dates: 20.
Source (désignation):
Les indicateurs du développement mondiale
Source (organisation):
World Bank national accounts data, and OECD National Accounts data files.
Catégories:
Economy & Growth
Dernière mise à jour
23 avr. 2017
Les indicateurs de changement de valeurs selon les années
En moyenne:
1.608 mds
Minimum:
418.246 mln.
1 janv. 1997
Maximum:
3.51 mds
1 janv. 2016
Pour la date d''observation
Valeur
Changement absolu
Le changement par rapport à la valeur précédente
1 janv. 1997
418.246 mln.
+418.246 mln.
0.0%
1 janv. 1998
456.901 mln.
+38.655 mln.
9.24%
1 janv. 1999
427.16 mln.
-29.741 mln.
-6.51%
1 janv. 2000
468.172 mln.
+41.012 mln.
9.6%
1 janv. 2001
516.668 mln.
+48.496 mln.
10.36%
1 janv. 2002
515.257 mln.
-1.41 mln.
-0.27%
1 janv. 2003
625.155 mln.
+109.897 mln.
21.33%
1 janv. 2004
1.116 mds
+490.91 mln.
78.53%
1 janv. 2005
1.201 mds
+84.681 mln.
7.59%
1 janv. 2006
1.406 mds
+204.776 mln.
17.05%
1 janv. 2007
1.533 mds
+127.663 mln.
9.08%
1 janv. 2008
1.86 mds
+327.286 mln.
21.35%
1 janv. 2009
1.992 mds
+131.527 mln.
7.07%
1 janv. 2010
1.786 mds
-206.298 mln.
-10.36%
1 janv. 2011
2.192 mds
+405.979 mln.
22.74%
1 janv. 2012
2.741 mds
+549.684 mln.
25.08%
1 janv. 2013
2.89 mds
+148.164 mln.
5.4%
1 janv. 2014
3.127 mds
+237.403 mln.
8.22%
1 janv. 2015
3.37 mds
+243.503 mln.
7.79%
1 janv. 2016
3.51 mds
+139.567 mln.
4.14%
Classement des pays selon les statistiques actuelles par années

Commentaires:

Envoyer
PremiumAbout & FeedbackUn accordConfidentialité
logo
© 2022 Selected Technologies LLC – Morgan Hill, California