29
/fr/
fr
AIzaSyAYiBZKx7MnpbEhh9jyipgxe19OcubqV5w
April 1, 2024
232317
Samoa
WSM
true
2
1
Imports of goods and services (current LCU)
2016,2015,2014,2013,2012,2011,2010,2009,2008,2007,2006,2005,2004,2003,2002,2001,2000,1999,1998,1997,1996,1995
Download
Bibliothèque de statistiques globales →Samoa →

Imports of goods and services (current LCU)

Cette statistique dans les autres pays:
AfghanistanAlbaniaAlgeriaAngolaAntigua and BarbudaArgentinaArmeniaArubaAustraliaAustriaAzerbaijanBahamas, TheBahrainBangladeshBarbadosBelarusBelgiumBelizeBeninBermudaBhutanBoliviaBosnia and HerzegovinaBotswanaBrazilBrunei DarussalamBulgariaBurkina FasoBurundiCabo VerdeCambodiaCameroonCanadaCentral African RepublicChadChileChinaColombiaComorosCongo, Dem. Rep.Congo, Rep.Costa RicaCote d'IvoireCroatiaCubaCyprusCzech RepublicDenmarkDjiboutiDominicaDominican RepublicEcuadorEgypt, Arab Rep.El SalvadorEquatorial GuineaEritreaEstoniaEthiopiaFaroe IslandsFijiFinlandFranceFrench PolynesiaGabonGambia, TheGeorgiaGermanyGhanaGreeceGrenadaGuatemalaGuineaGuinea-BissauGuyanaHaitiHondurasHong Kong SAR, ChinaHungaryIcelandIndiaIndonesiaIran, Islamic Rep.IraqIrelandIsraelItalyJamaicaJapanJordanKazakhstanKenyaKiribatiKorea, Rep.KosovoKuwaitKyrgyz RepublicLao PDRLatviaLebanonLesothoLiberiaLibyaLithuaniaLuxembourgMacao SAR, ChinaMacedonia, FYRMadagascarMalawiMalaysiaMaldivesMaliMaltaMauritaniaMauritiusMexicoMicronesia, Fed. Sts.MoldovaMongoliaMontenegroMoroccoMozambiqueMyanmarNamibiaNepalNetherlandsNew CaledoniaNew ZealandNicaraguaNigerNigeriaNorwayOmanPakistanPalauPanamaPapua New GuineaParaguayPeruPhilippinesPolandPortugalPuerto RicoQatarRomaniaRussian FederationRwandaSamoaSaudi ArabiaSenegalSerbiaSeychellesSierra LeoneSingaporeSlovak RepublicSloveniaSolomon IslandsSomaliaSouth AfricaSouth SudanSpainSri LankaSt. Kitts and NevisSt. LuciaSt. Vincent and the GrenadinesSudanSurinameSwazilandSwedenSwitzerlandSyrian Arab RepublicTajikistanTanzaniaThailandTimor-LesteTogoTongaTrinidad and TobagoTunisiaTurkeyTurkmenistanUgandaUkraineUnited Arab EmiratesUnited KingdomUnited StatesUruguayUzbekistanVanuatuVenezuela, RBVietnamWest Bank and GazaYemen, Rep.ZambiaZimbabwe
La ligne de temps
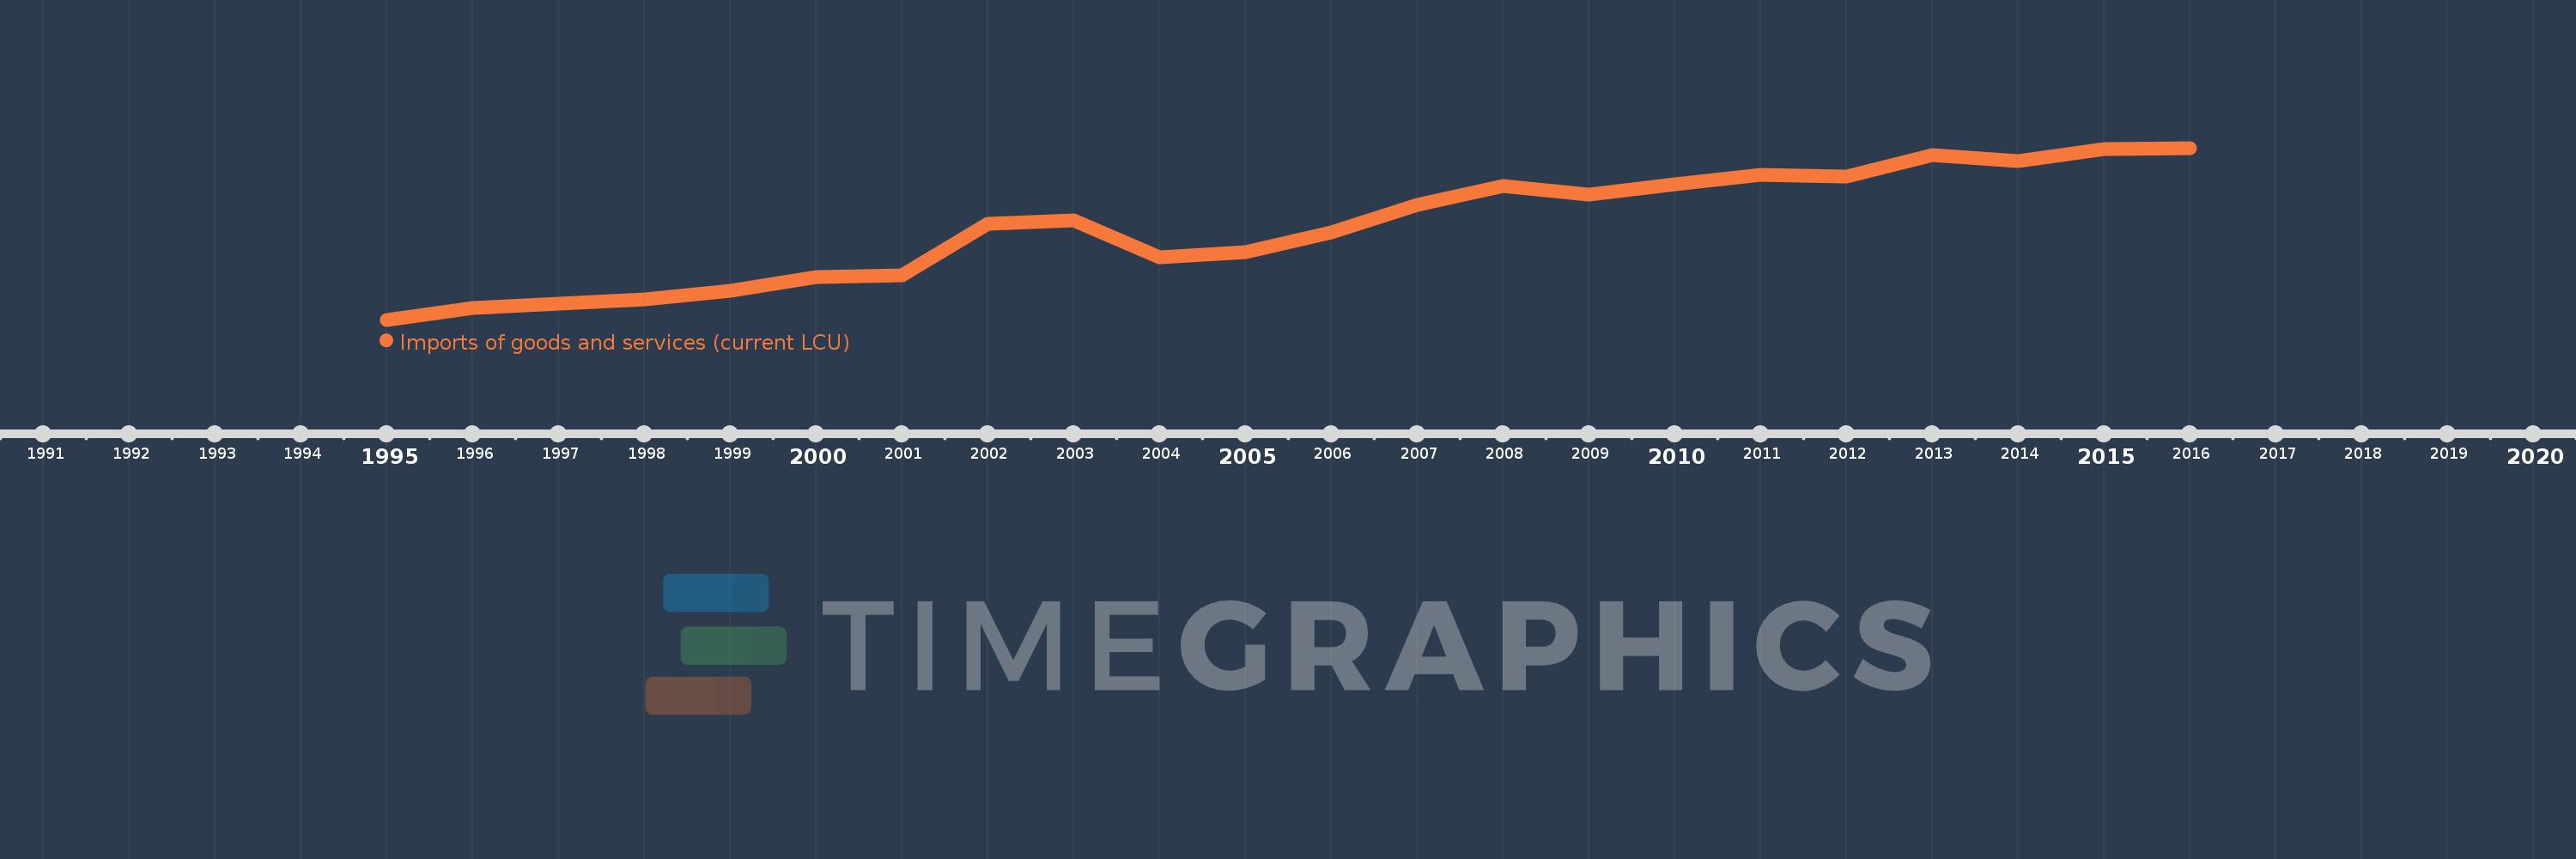
Cette échelle de temps montre un graphique de 1995 année à 2016 année Samoa. Les données jusqu'à 1994 année ne sont pas présentés. Quantité d'observations actuelles selon dates: 22.
Source (désignation):
Les indicateurs du développement mondiale
Source (organisation):
World Bank national accounts data, and OECD National Accounts data files.
Catégories:
Economy & Growth
Dernière mise à jour
23 avr. 2017
Les indicateurs de changement de valeurs selon les années
En moyenne:
644.605 mln.
Minimum:
246.0 mln.
1 janv. 1995
Maximum:
984.216 mln.
1 janv. 2016
Pour la date d''observation
Valeur
Changement absolu
Le changement par rapport à la valeur précédente
1 janv. 1995
246.0 mln.
+246.0 mln.
0.0%
1 janv. 1996
296.58 mln.
+50.58 mln.
20.56%
1 janv. 1997
314.25 mln.
+17.67 mln.
5.96%
1 janv. 1998
333.66 mln.
+19.41 mln.
6.18%
1 janv. 1999
371.96 mln.
+38.3 mln.
11.48%
1 janv. 2000
430.95 mln.
+58.99 mln.
15.86%
1 janv. 2001
435.397 mln.
+4.447 mln.
1.03%
1 janv. 2002
660.024 mln.
+224.627 mln.
51.59%
1 janv. 2003
673.255 mln.
+13.231 mln.
2.0%
1 janv. 2004
515.885 mln.
-157.371 mln.
-23.37%
1 janv. 2005
536.78 mln.
+20.896 mln.
4.05%
1 janv. 2006
623.036 mln.
+86.255 mln.
16.07%
1 janv. 2007
738.855 mln.
+115.82 mln.
18.59%
1 janv. 2008
819.536 mln.
+80.681 mln.
10.92%
1 janv. 2009
785.547 mln.
-33.989 mln.
-4.15%
1 janv. 2010
828.73 mln.
+43.183 mln.
5.5%
1 janv. 2011
866.908 mln.
+38.178 mln.
4.61%
1 janv. 2012
859.486 mln.
-7.421 mln.
-0.86%
1 janv. 2013
953.229 mln.
+93.743 mln.
10.91%
1 janv. 2014
927.992 mln.
-25.237 mln.
-2.65%
1 janv. 2015
979.025 mln.
+51.033 mln.
5.5%
1 janv. 2016
984.216 mln.
+5.191 mln.
0.53%
Classement des pays selon les statistiques actuelles par années

Commentaires:

Envoyer
PremiumAbout & FeedbackUn accordConfidentialité
logo
© 2022 Selected Technologies LLC – Morgan Hill, California