33
/fr/
AIzaSyAYiBZKx7MnpbEhh9jyipgxe19OcubqV5w
August 1, 2025
217548
Palau
PLW
true
2
1
Imports of goods and services (current LCU)
2016,2015,2014,2013,2012,2011,2010,2009,2008,2007,2006,2005,2004,2003,2002,2001,2000,1999,1998,1997,1996,1995,1994,1993,1992
Download
Bibliothèque de statistiques globales →Palau →

Imports of goods and services (current LCU)

Cette statistique dans les autres pays:

AfghanistanAlbaniaAlgeriaAngolaAntigua and BarbudaArgentinaArmeniaArubaAustraliaAustriaAzerbaijanBahamas, TheBahrainBangladeshBarbadosBelarusBelgiumBelizeBeninBermudaBhutanBoliviaBosnia and HerzegovinaBotswanaBrazilBrunei DarussalamBulgariaBurkina FasoBurundiCabo VerdeCambodiaCameroonCanadaCentral African RepublicChadChileChinaColombiaComorosCongo, Dem. Rep.Congo, Rep.Costa RicaCote d'IvoireCroatiaCubaCyprusCzech RepublicDenmarkDjiboutiDominicaDominican RepublicEcuadorEgypt, Arab Rep.El SalvadorEquatorial GuineaEritreaEstoniaEthiopiaFaroe IslandsFijiFinlandFranceFrench PolynesiaGabonGambia, TheGeorgiaGermanyGhanaGreeceGrenadaGuatemalaGuineaGuinea-BissauGuyanaHaitiHondurasHong Kong SAR, ChinaHungaryIcelandIndiaIndonesiaIran, Islamic Rep.IraqIrelandIsraelItalyJamaicaJapanJordanKazakhstanKenyaKiribatiKorea, Rep.KosovoKuwaitKyrgyz RepublicLao PDRLatviaLebanonLesothoLiberiaLibyaLithuaniaLuxembourgMacao SAR, ChinaMacedonia, FYRMadagascarMalawiMalaysiaMaldivesMaliMaltaMauritaniaMauritiusMexicoMicronesia, Fed. Sts.MoldovaMongoliaMontenegroMoroccoMozambiqueMyanmarNamibiaNepalNetherlandsNew CaledoniaNew ZealandNicaraguaNigerNigeriaNorwayOmanPakistanPalauPanamaPapua New GuineaParaguayPeruPhilippinesPolandPortugalPuerto RicoQatarRomaniaRussian FederationRwandaSamoaSaudi ArabiaSenegalSerbiaSeychellesSierra LeoneSingaporeSlovak RepublicSloveniaSolomon IslandsSomaliaSouth AfricaSouth SudanSpainSri LankaSt. Kitts and NevisSt. LuciaSt. Vincent and the GrenadinesSudanSurinameSwazilandSwedenSwitzerlandSyrian Arab RepublicTajikistanTanzaniaThailandTimor-LesteTogoTongaTrinidad and TobagoTunisiaTurkeyTurkmenistanUgandaUkraineUnited Arab EmiratesUnited KingdomUnited StatesUruguayUzbekistanVanuatuVenezuela, RBVietnamWest Bank and GazaYemen, Rep.ZambiaZimbabwe

La ligne de temps

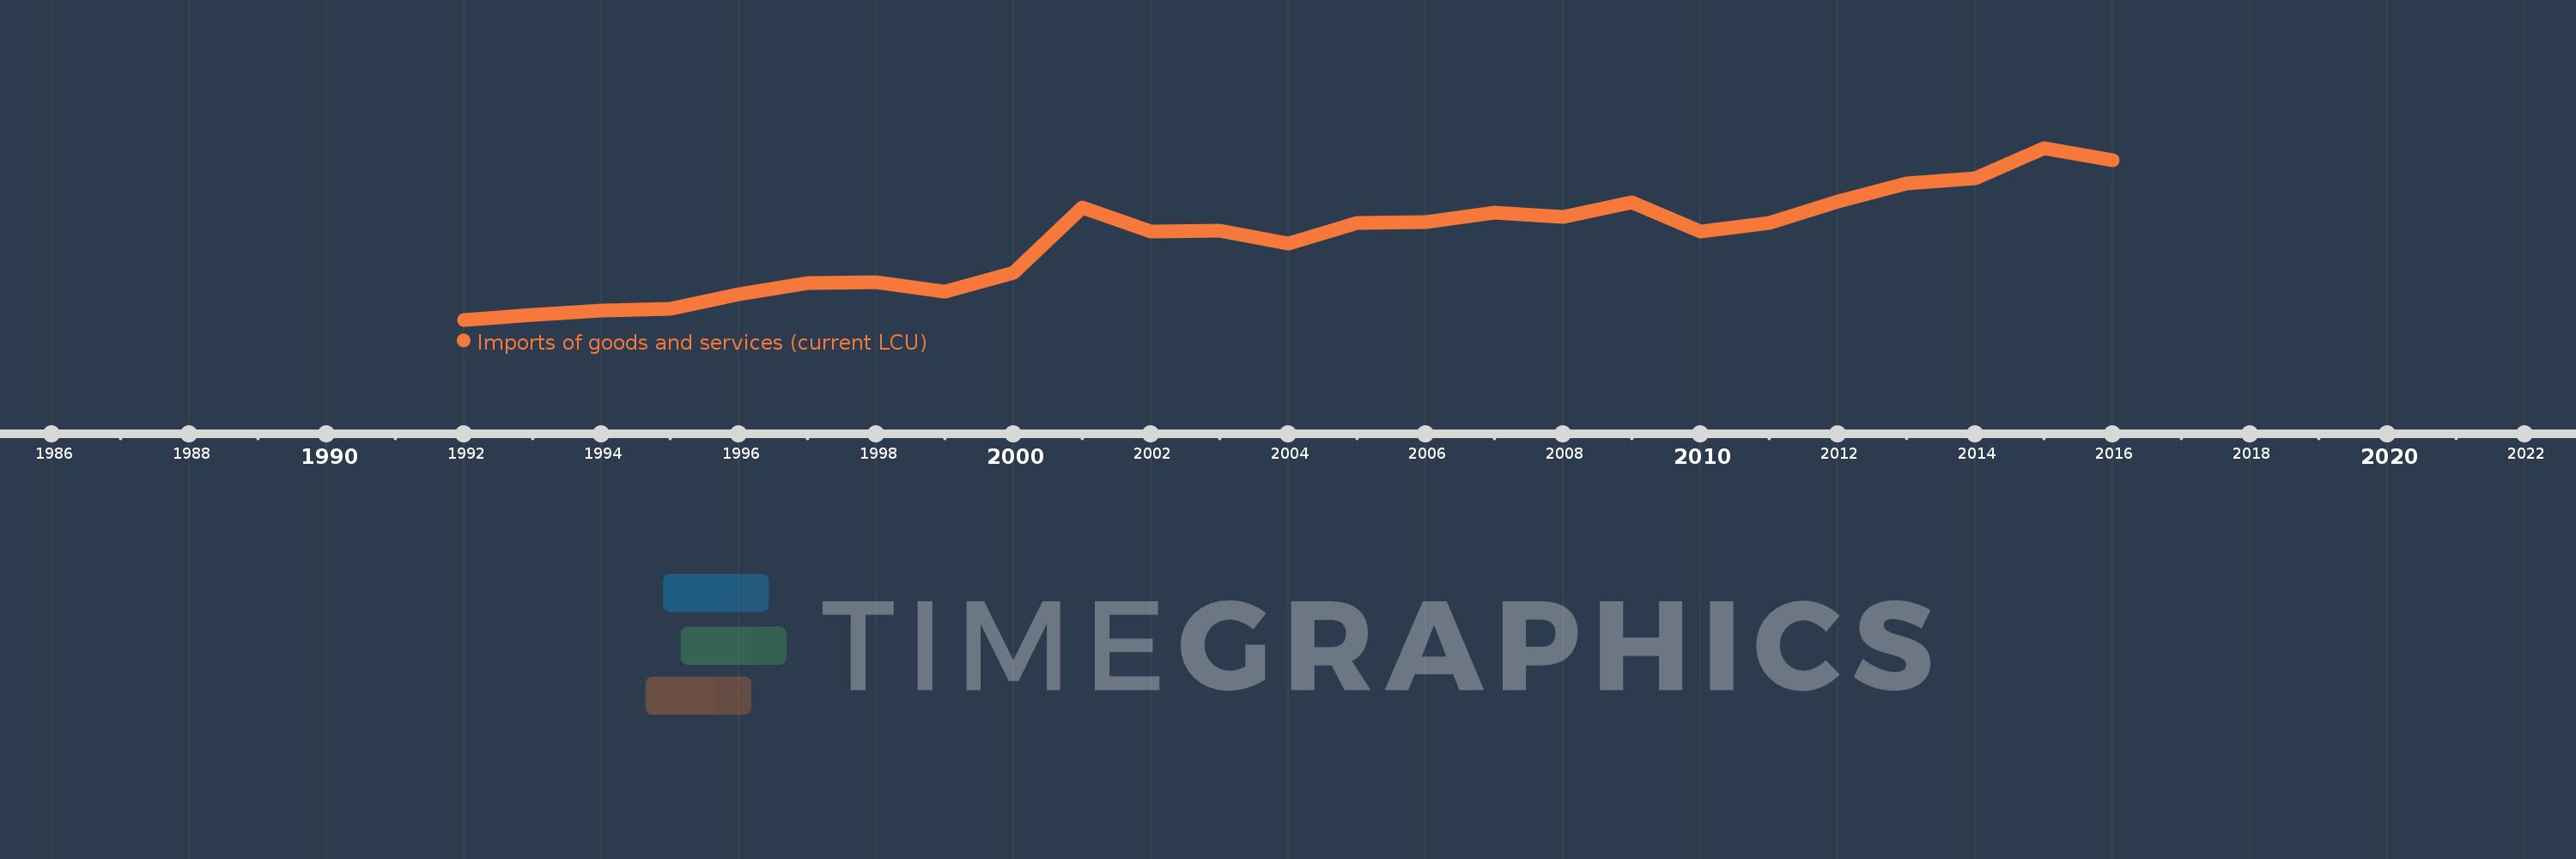
Cette échelle de temps montre un graphique de 1992 année à 2016 année Palau. Les données jusqu'à 1991 année ne sont pas présentés. Quantité d'observations actuelles selon dates: 25.

Source (désignation):

Les indicateurs du développement mondiale

Source (organisation):

World Bank national accounts data, and OECD National Accounts data files.

Catégories:

Economy & Growth

Dernière mise à jour

23 avr. 2017

Les indicateurs de changement de valeurs selon les années

En moyenne:
119.731 mln.
Minimum:
32.3 mln.
1 janv. 1992
Maximum:
219.981 mln.
1 janv. 2015
Pour la date d''observation
Valeur
Changement absolu
Le changement par rapport à la valeur précédente
1 janv. 1992
32.3 mln.
+32.3 mln.
0.0%
1 janv. 1993
38.1 mln.
+5.8 mln.
17.96%
1 janv. 1994
42.2 mln.
+4.1 mln.
10.76%
1 janv. 1995
44.2 mln.
+2.0 mln.
4.74%
1 janv. 1996
60.438 mln.
+16.238 mln.
36.74%
1 janv. 1997
72.424 mln.
+11.986 mln.
19.83%
1 janv. 1998
72.894 mln.
+470.0 milles
0.65%
1 janv. 1999
63.222 mln.
-9.672 mln.
-13.27%
1 janv. 2000
83.852 mln.
+20.63 mln.
32.63%
1 janv. 2001
155.416 mln.
+71.564 mln.
85.35%
1 janv. 2002
128.565 mln.
-26.851 mln.
-17.28%
1 janv. 2003
129.679 mln.
+1.114 mln.
0.87%
1 janv. 2004
115.52 mln.
-14.159 mln.
-10.92%
1 janv. 2005
137.999 mln.
+22.479 mln.
19.46%
1 janv. 2006
138.745 mln.
+746.3 milles
0.54%
1 janv. 2007
148.926 mln.
+10.181 mln.
7.34%
1 janv. 2008
145.066 mln.
-3.86 mln.
-2.59%
1 janv. 2009
160.858 mln.
+15.792 mln.
10.89%
1 janv. 2010
128.248 mln.
-32.61 mln.
-20.27%
1 janv. 2011
138.484 mln.
+10.236 mln.
7.98%
1 janv. 2012
161.388 mln.
+22.905 mln.
16.54%
1 janv. 2013
180.83 mln.
+19.442 mln.
12.05%
1 janv. 2014
186.948 mln.
+6.119 mln.
3.38%
1 janv. 2015
219.981 mln.
+33.033 mln.
17.67%
1 janv. 2016
207.0 mln.
-12.981 mln.
-5.9%

Classement des pays selon les statistiques actuelles par années