29
/fr/
fr
AIzaSyAYiBZKx7MnpbEhh9jyipgxe19OcubqV5w
April 1, 2024
231954
Samoa
WSM
true
2
1
Agriculture, value added (current LCU)
2016,2015,2014,2013,2012,2011,2010,2009,2008,2007,2006,2005,2004,2003,2002,2001,2000,1999,1998,1997,1996,1995
Download
Bibliothèque de statistiques globales →Samoa →

Agriculture, value added (current LCU)

Cette statistique dans les autres pays:
AfghanistanAlbaniaAlgeriaAndorraAngolaAntigua and BarbudaArgentinaArmeniaArubaAustraliaAustriaAzerbaijanBahamas, TheBahrainBangladeshBarbadosBelarusBelgiumBelizeBeninBermudaBhutanBoliviaBosnia and HerzegovinaBotswanaBrazilBrunei DarussalamBulgariaBurkina FasoBurundiCabo VerdeCambodiaCameroonCanadaCayman IslandsCentral African RepublicChadChileChinaColombiaComorosCongo, Dem. Rep.Congo, Rep.Costa RicaCote d'IvoireCroatiaCubaCyprusCzech RepublicDenmarkDjiboutiDominicaDominican RepublicEcuadorEgypt, Arab Rep.El SalvadorEquatorial GuineaEritreaEstoniaEthiopiaFijiFinlandFranceFrench PolynesiaGabonGambia, TheGeorgiaGermanyGhanaGreeceGrenadaGuatemalaGuineaGuinea-BissauGuyanaHondurasHong Kong SAR, ChinaHungaryIcelandIndiaIndonesiaIran, Islamic Rep.IraqIrelandItalyJamaicaJapanJordanKazakhstanKenyaKiribatiKorea, Rep.KosovoKuwaitKyrgyz RepublicLao PDRLatviaLebanonLesothoLiberiaLibyaLithuaniaLuxembourgMacao SAR, ChinaMacedonia, FYRMadagascarMalawiMalaysiaMaldivesMaliMaltaMarshall IslandsMauritaniaMauritiusMexicoMicronesia, Fed. Sts.MoldovaMongoliaMontenegroMoroccoMozambiqueMyanmarNamibiaNepalNetherlandsNew CaledoniaNew ZealandNicaraguaNigerNigeriaNorwayOmanPakistanPalauPanamaPapua New GuineaParaguayPeruPhilippinesPolandPortugalPuerto RicoQatarRomaniaRussian FederationRwandaSamoaSao Tome and PrincipeSaudi ArabiaSenegalSerbiaSeychellesSierra LeoneSingaporeSlovak RepublicSloveniaSolomon IslandsSomaliaSouth AfricaSpainSri LankaSt. Kitts and NevisSt. LuciaSt. Vincent and the GrenadinesSudanSurinameSwazilandSwedenSwitzerlandSyrian Arab RepublicTajikistanTanzaniaThailandTimor-LesteTogoTongaTrinidad and TobagoTunisiaTurkeyTurkmenistanTuvaluUgandaUkraineUnited Arab EmiratesUnited KingdomUnited StatesUruguayUzbekistanVanuatuVenezuela, RBVietnamWest Bank and GazaYemen, Rep.ZambiaZimbabwe
La ligne de temps
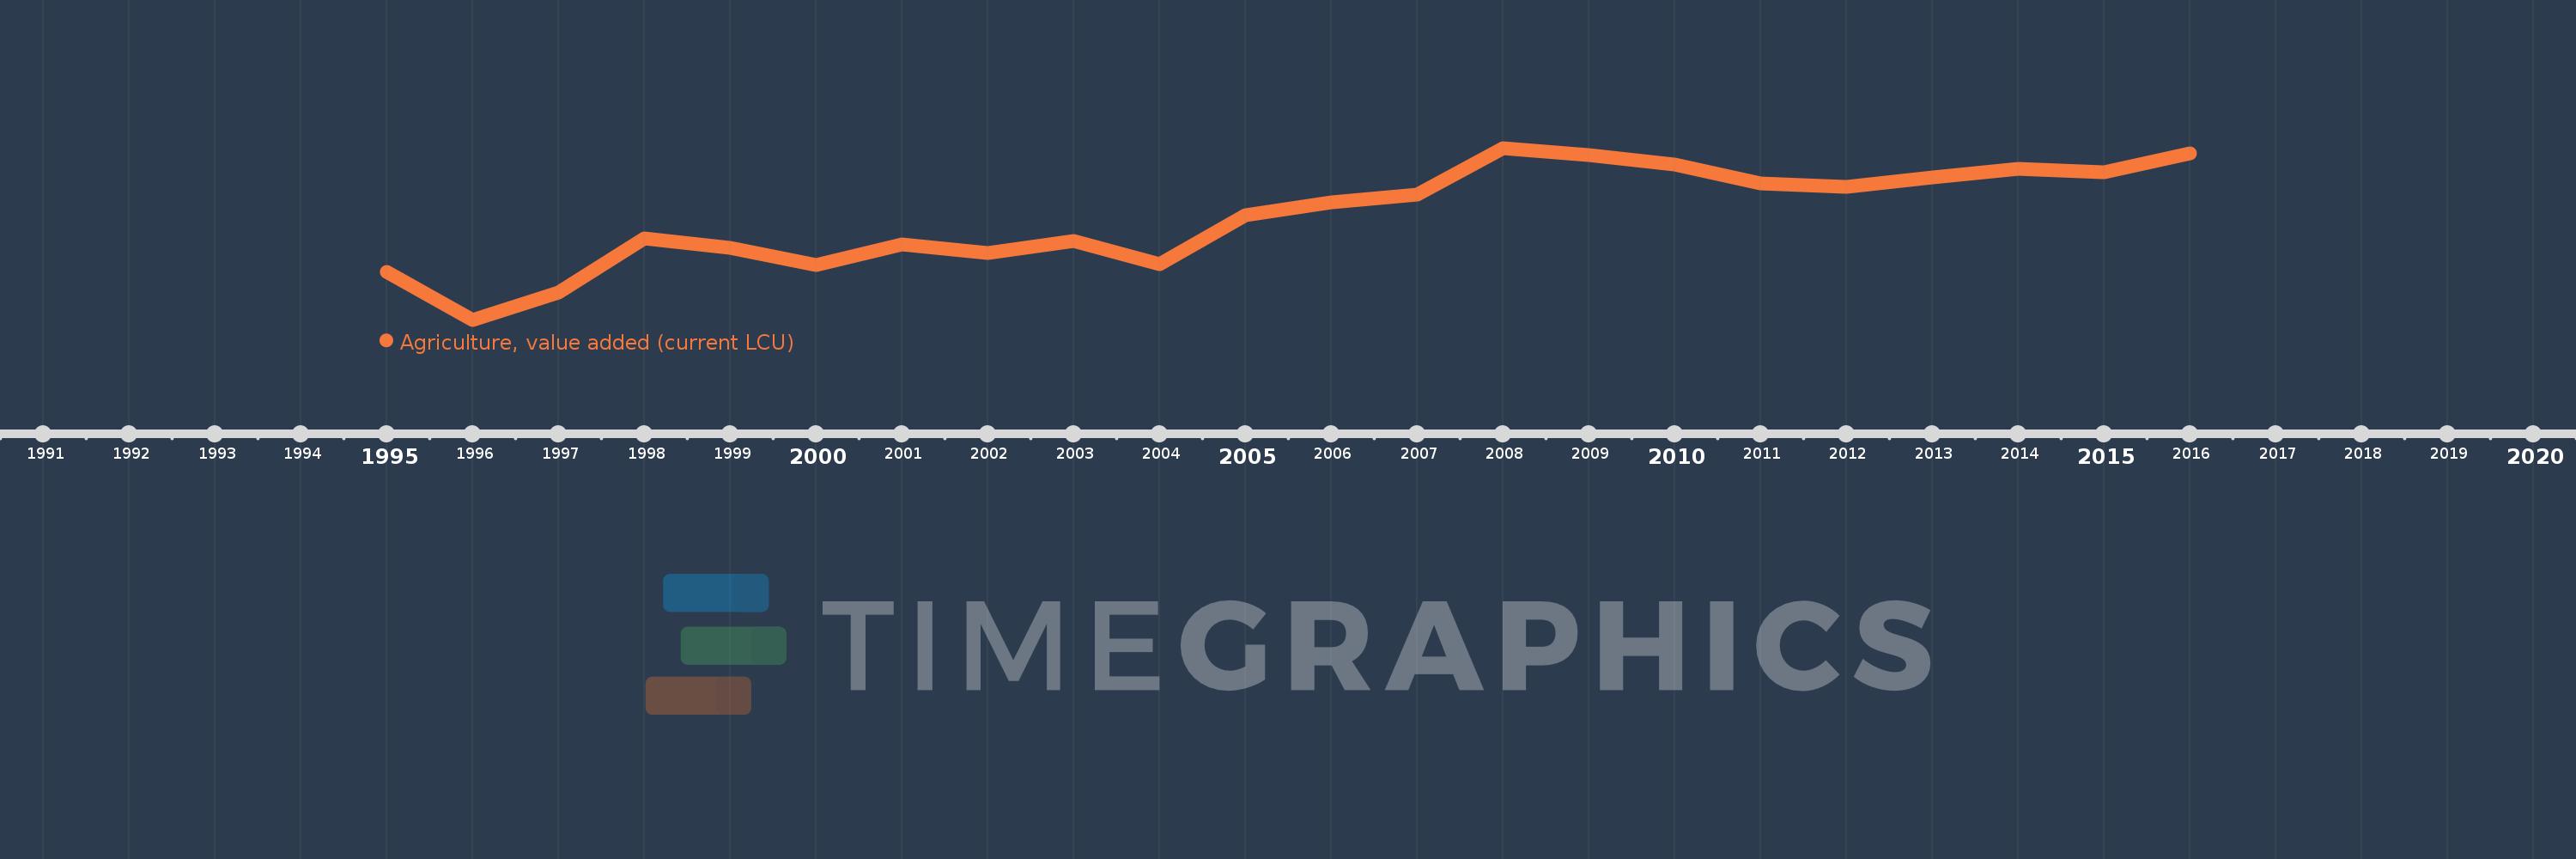
Cette échelle de temps montre un graphique de 1995 année à 2016 année Samoa. Les données jusqu'à 1994 année ne sont pas présentés. Quantité d'observations actuelles selon dates: 22.
Source (désignation):
Les indicateurs du développement mondiale
Source (organisation):
World Bank national accounts data, and OECD National Accounts data files.
Catégories:
Economy & Growth
Dernière mise à jour
23 avr. 2017
Les indicateurs de changement de valeurs selon les années
En moyenne:
152.848 mln.
Minimum:
98.879 mln.
1 janv. 1996
Maximum:
188.463 mln.
1 janv. 2008
Pour la date d''observation
Valeur
Changement absolu
Le changement par rapport à la valeur précédente
1 janv. 1995
123.77 mln.
+123.77 mln.
0.0%
1 janv. 1996
98.879 mln.
-24.891 mln.
-20.11%
1 janv. 1997
113.066 mln.
+14.187 mln.
14.35%
1 janv. 1998
141.486 mln.
+28.42 mln.
25.14%
1 janv. 1999
136.567 mln.
-4.919 mln.
-3.48%
1 janv. 2000
127.586 mln.
-8.981 mln.
-6.58%
1 janv. 2001
138.088 mln.
+10.502 mln.
8.23%
1 janv. 2002
133.717 mln.
-4.371 mln.
-3.17%
1 janv. 2003
139.805 mln.
+6.088 mln.
4.55%
1 janv. 2004
127.974 mln.
-11.831 mln.
-8.46%
1 janv. 2005
153.512 mln.
+25.538 mln.
19.96%
1 janv. 2006
160.279 mln.
+6.767 mln.
4.41%
1 janv. 2007
164.098 mln.
+3.819 mln.
2.38%
1 janv. 2008
188.463 mln.
+24.364 mln.
14.85%
1 janv. 2009
184.918 mln.
-3.545 mln.
-1.88%
1 janv. 2010
179.956 mln.
-4.962 mln.
-2.68%
1 janv. 2011
170.078 mln.
-9.878 mln.
-5.49%
1 janv. 2012
168.142 mln.
-1.936 mln.
-1.14%
1 janv. 2013
173.054 mln.
+4.912 mln.
2.92%
1 janv. 2014
177.639 mln.
+4.585 mln.
2.65%
1 janv. 2015
176.008 mln.
-1.631 mln.
-0.92%
1 janv. 2016
185.582 mln.
+9.574 mln.
5.44%
Classement des pays selon les statistiques actuelles par années

Commentaires:

Envoyer
PremiumAbout & FeedbackUn accordConfidentialité
logo
© 2022 Selected Technologies LLC – Morgan Hill, California