33
/fr/
AIzaSyAYiBZKx7MnpbEhh9jyipgxe19OcubqV5w
August 1, 2025
181838
Luxembourg
LUX
true
2
1
Agriculture, value added (current LCU)
2016,2015,2014,2013,2012,2011,2010,2009,2008,2007,2006,2005,2004,2003,2002,2001,2000,1999,1998,1997,1996
Download
Bibliothèque de statistiques globales →Luxembourg →

Agriculture, value added (current LCU)

Cette statistique dans les autres pays:

AfghanistanAlbaniaAlgeriaAndorraAngolaAntigua and BarbudaArgentinaArmeniaArubaAustraliaAustriaAzerbaijanBahamas, TheBahrainBangladeshBarbadosBelarusBelgiumBelizeBeninBermudaBhutanBoliviaBosnia and HerzegovinaBotswanaBrazilBrunei DarussalamBulgariaBurkina FasoBurundiCabo VerdeCambodiaCameroonCanadaCayman IslandsCentral African RepublicChadChileChinaColombiaComorosCongo, Dem. Rep.Congo, Rep.Costa RicaCote d'IvoireCroatiaCubaCyprusCzech RepublicDenmarkDjiboutiDominicaDominican RepublicEcuadorEgypt, Arab Rep.El SalvadorEquatorial GuineaEritreaEstoniaEthiopiaFijiFinlandFranceFrench PolynesiaGabonGambia, TheGeorgiaGermanyGhanaGreeceGrenadaGuatemalaGuineaGuinea-BissauGuyanaHondurasHong Kong SAR, ChinaHungaryIcelandIndiaIndonesiaIran, Islamic Rep.IraqIrelandItalyJamaicaJapanJordanKazakhstanKenyaKiribatiKorea, Rep.KosovoKuwaitKyrgyz RepublicLao PDRLatviaLebanonLesothoLiberiaLibyaLithuaniaLuxembourgMacao SAR, ChinaMacedonia, FYRMadagascarMalawiMalaysiaMaldivesMaliMaltaMarshall IslandsMauritaniaMauritiusMexicoMicronesia, Fed. Sts.MoldovaMongoliaMontenegroMoroccoMozambiqueMyanmarNamibiaNepalNetherlandsNew CaledoniaNew ZealandNicaraguaNigerNigeriaNorwayOmanPakistanPalauPanamaPapua New GuineaParaguayPeruPhilippinesPolandPortugalPuerto RicoQatarRomaniaRussian FederationRwandaSamoaSao Tome and PrincipeSaudi ArabiaSenegalSerbiaSeychellesSierra LeoneSingaporeSlovak RepublicSloveniaSolomon IslandsSomaliaSouth AfricaSpainSri LankaSt. Kitts and NevisSt. LuciaSt. Vincent and the GrenadinesSudanSurinameSwazilandSwedenSwitzerlandSyrian Arab RepublicTajikistanTanzaniaThailandTimor-LesteTogoTongaTrinidad and TobagoTunisiaTurkeyTurkmenistanTuvaluUgandaUkraineUnited Arab EmiratesUnited KingdomUnited StatesUruguayUzbekistanVanuatuVenezuela, RBVietnamWest Bank and GazaYemen, Rep.ZambiaZimbabwe

La ligne de temps

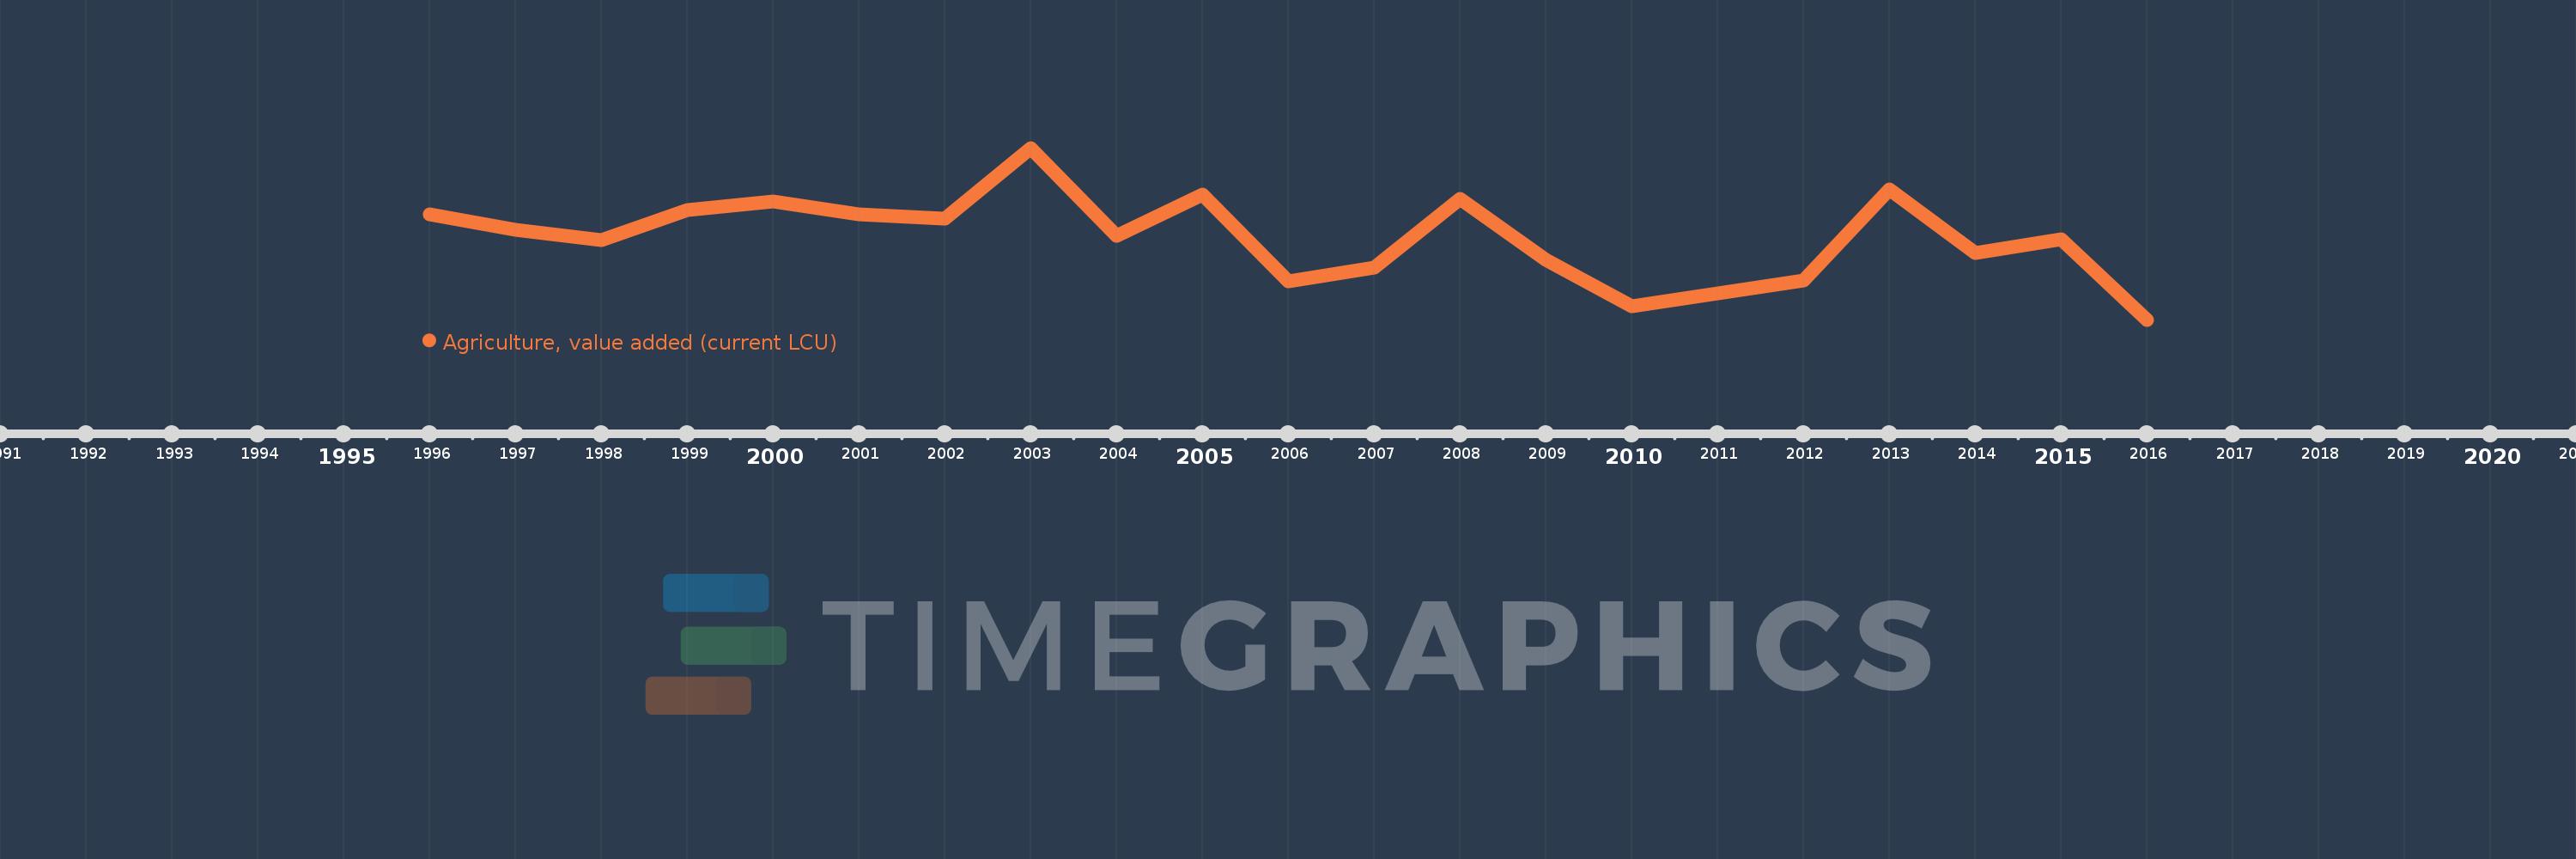
Cette échelle de temps montre un graphique de 1996 année à 2016 année Luxembourg. Les données jusqu'à 1995 année ne sont pas présentés. Quantité d'observations actuelles selon dates: 21.

Source (désignation):

Les indicateurs du développement mondiale

Source (organisation):

World Bank national accounts data, and OECD National Accounts data files.

Catégories:

Economy & Growth

Dernière mise à jour

23 avr. 2017

Les indicateurs de changement de valeurs selon les années

En moyenne:
130.797 mln.
Minimum:
85.6 mln.
1 janv. 2016
Maximum:
180.6 mln.
1 janv. 2003
Pour la date d''observation
Valeur
Changement absolu
Le changement par rapport à la valeur précédente
1 janv. 1996
143.938 mln.
+143.938 mln.
0.0%
1 janv. 1997
135.36 mln.
-8.578 mln.
-5.96%
1 janv. 1998
129.491 mln.
-5.869 mln.
-4.34%
1 janv. 1999
146.351 mln.
+16.86 mln.
13.02%
1 janv. 2000
150.842 mln.
+4.491 mln.
3.07%
1 janv. 2001
143.747 mln.
-7.095 mln.
-4.7%
1 janv. 2002
141.3 mln.
-2.447 mln.
-1.7%
1 janv. 2003
180.6 mln.
+39.3 mln.
27.81%
1 janv. 2004
131.8 mln.
-48.8 mln.
-27.02%
1 janv. 2005
154.8 mln.
+23.0 mln.
17.45%
1 janv. 2006
106.8 mln.
-48.0 mln.
-31.01%
1 janv. 2007
114.3 mln.
+7.5 mln.
7.02%
1 janv. 2008
152.3 mln.
+38.0 mln.
33.25%
1 janv. 2009
118.9 mln.
-33.4 mln.
-21.93%
1 janv. 2010
93.0 mln.
-25.9 mln.
-21.78%
1 janv. 2011
100.0 mln.
+7.0 mln.
7.53%
1 janv. 2012
107.3 mln.
+7.3 mln.
7.3%
1 janv. 2013
157.8 mln.
+50.5 mln.
47.06%
1 janv. 2014
122.5 mln.
-35.3 mln.
-22.37%
1 janv. 2015
130.0 mln.
+7.5 mln.
6.12%
1 janv. 2016
85.6 mln.
-44.4 mln.
-34.15%

Classement des pays selon les statistiques actuelles par années