33
/fr/
AIzaSyAYiBZKx7MnpbEhh9jyipgxe19OcubqV5w
August 1, 2025
197975
Moldova
MDA
true
2
1
Net taxes on products (constant LCU)
2016,2015,2014,2013,2012,2011,2010,2009,2008,2007,2006,2005,2004,2003,2002,2001,2000,1999,1998,1997,1996
Download
Bibliothèque de statistiques globales →Moldova →

Net taxes on products (constant LCU)

Cette statistique dans les autres pays:

AfghanistanAlbaniaAlgeriaAntigua and BarbudaArgentinaArmeniaAustraliaAustriaAzerbaijanBahamas, TheBangladeshBelarusBelgiumBelizeBeninBermudaBhutanBoliviaBosnia and HerzegovinaBotswanaBrazilBulgariaBurkina FasoBurundiCabo VerdeCambodiaCameroonCanadaCentral African RepublicChadChileColombiaCongo, Dem. Rep.Costa RicaCroatiaCubaCyprusCzech RepublicDenmarkDjiboutiDominicaDominican RepublicEcuadorEl SalvadorEquatorial GuineaEritreaEstoniaEthiopiaFijiFinlandFranceGabonGambia, TheGeorgiaGermanyGhanaGreeceGrenadaGuatemalaGuineaGuinea-BissauGuyanaHaitiHondurasHong Kong SAR, ChinaHungaryIndiaIndonesiaIran, Islamic Rep.IrelandItalyJamaicaJapanJordanKazakhstanKenyaKiribatiKorea, Rep.KosovoKyrgyz RepublicLao PDRLatviaLebanonLesothoLiberiaLithuaniaLuxembourgMacedonia, FYRMadagascarMalawiMaldivesMaliMarshall IslandsMauritaniaMauritiusMexicoMicronesia, Fed. Sts.MoldovaMongoliaMontenegroMoroccoMozambiqueNamibiaNepalNetherlandsNew ZealandNicaraguaNigerNigeriaNorwayOmanPakistanPalauPanamaPapua New GuineaParaguayPeruPhilippinesPolandPortugalRomaniaRussian FederationRwandaSao Tome and PrincipeSenegalSerbiaSeychellesSierra LeoneSingaporeSlovak RepublicSloveniaSolomon IslandsSomaliaSouth AfricaSpainSri LankaSt. Kitts and NevisSt. LuciaSt. Vincent and the GrenadinesSudanSurinameSwazilandSwedenSwitzerlandTajikistanTanzaniaTimor-LesteTongaTrinidad and TobagoTunisiaTurkeyTuvaluUgandaUkraineUnited Arab EmiratesUnited KingdomUnited StatesUruguayUzbekistanVanuatuVenezuela, RBVietnamWest Bank and GazaZambiaZimbabwe

La ligne de temps

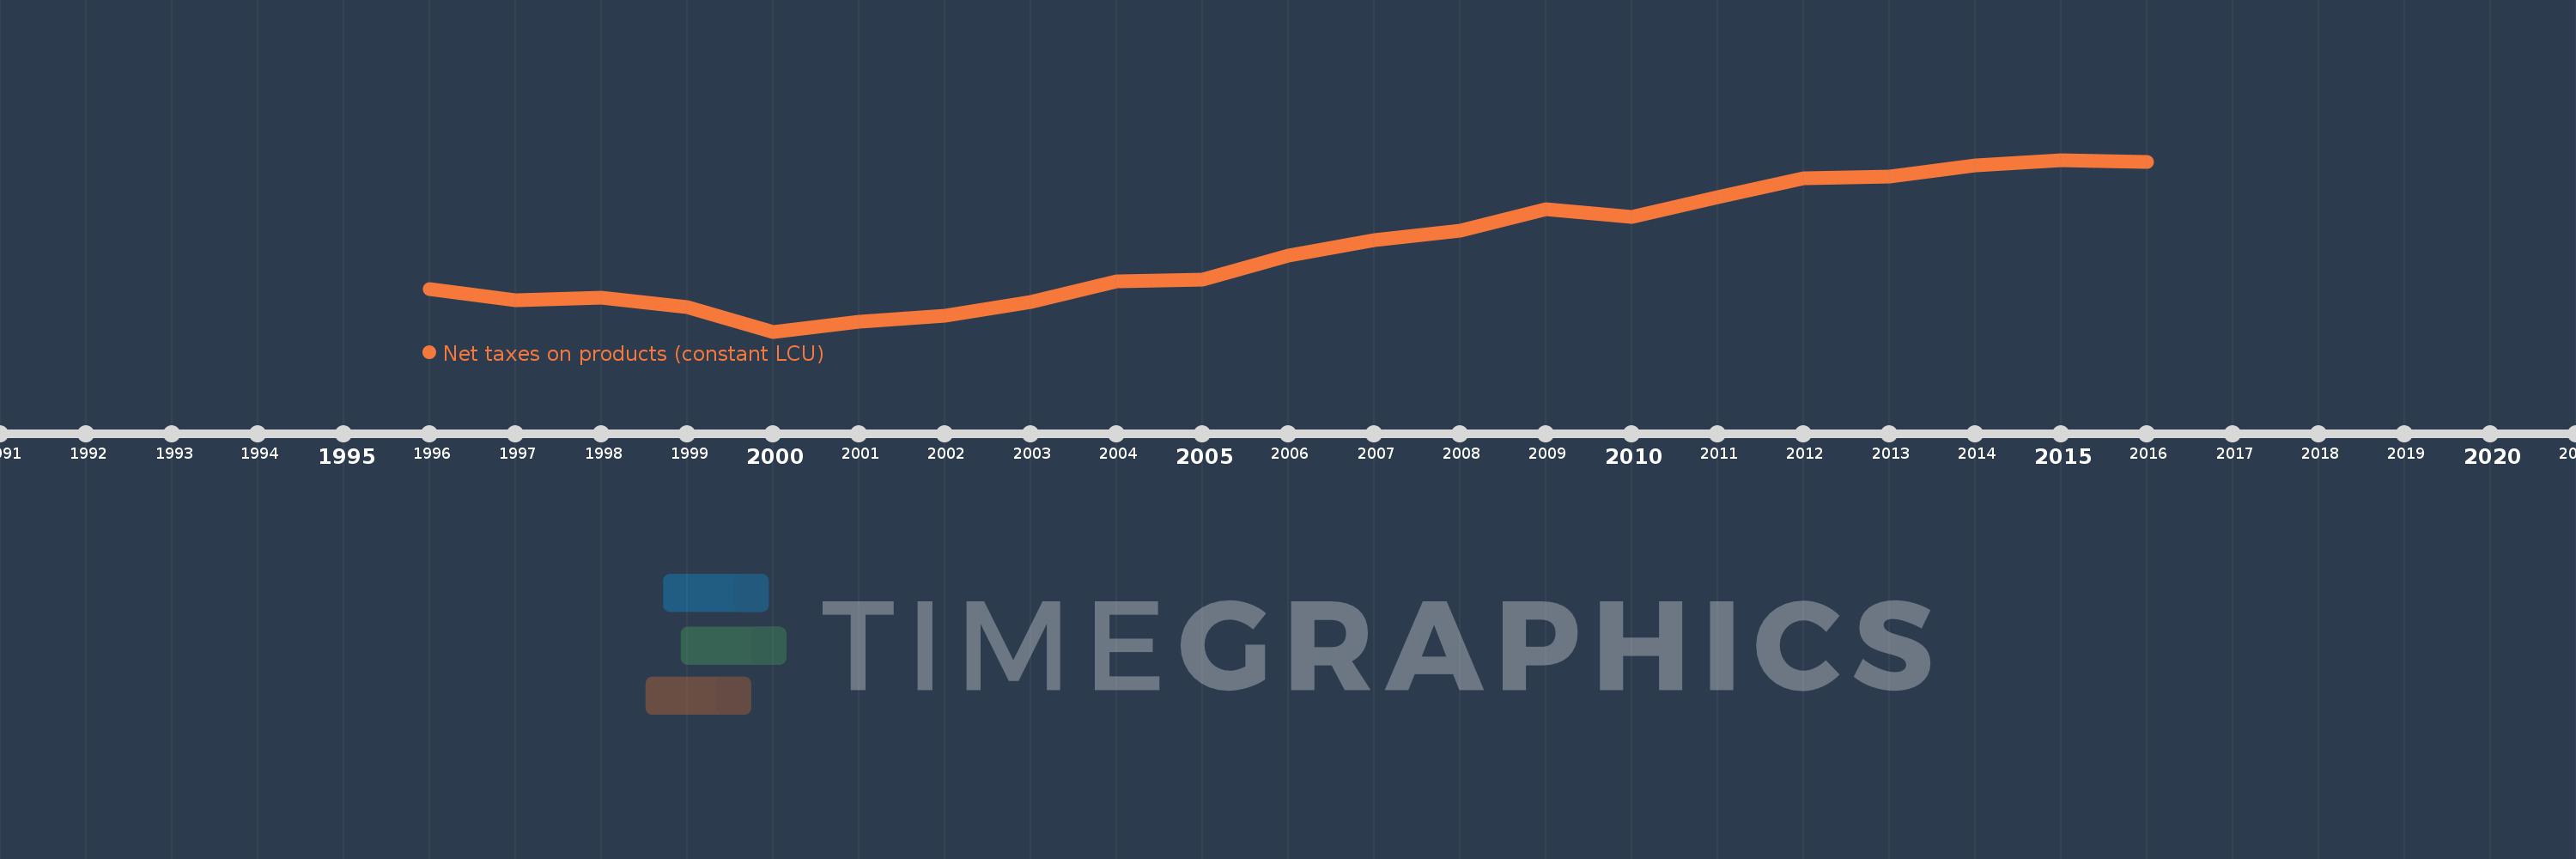
Cette échelle de temps montre un graphique de 1996 année à 2016 année Moldova. Les données jusqu'à 1995 année ne sont pas présentés. Quantité d'observations actuelles selon dates: 21.

Source (désignation):

Les indicateurs du développement mondiale

Source (organisation):

World Bank national accounts data, and OECD National Accounts data files.

Catégories:

Economy & Growth

Dernière mise à jour

23 avr. 2017

Les indicateurs de changement de valeurs selon les années

En moyenne:
4.116 mds
Minimum:
1.705 mds
1 janv. 2000
Maximum:
6.687 mds
1 janv. 2015
Pour la date d''observation
Valeur
Changement absolu
Le changement par rapport à la valeur précédente
1 janv. 1996
2.932 mds
+2.932 mds
0.0%
1 janv. 1997
2.621 mds
-311.328 mln.
-10.62%
1 janv. 1998
2.7 mds
+79.323 mln.
3.03%
1 janv. 1999
2.418 mds
-282.413 mln.
-10.46%
1 janv. 2000
1.705 mds
-713.146 mln.
-29.49%
1 janv. 2001
1.998 mds
+292.711 mln.
17.17%
1 janv. 2002
2.169 mds
+171.271 mln.
8.57%
1 janv. 2003
2.553 mds
+384.267 mln.
17.72%
1 janv. 2004
3.15 mds
+597.448 mln.
23.4%
1 janv. 2005
3.218 mds
+67.16 mln.
2.13%
1 janv. 2006
3.915 mds
+697.572 mln.
21.68%
1 janv. 2007
4.347 mds
+431.618 mln.
11.02%
1 janv. 2008
4.639 mds
+291.992 mln.
6.72%
1 janv. 2009
5.248 mds
+608.692 mln.
13.12%
1 janv. 2010
5.028 mds
-219.864 mln.
-4.19%
1 janv. 2011
5.614 mds
+586.225 mln.
11.66%
1 janv. 2012
6.152 mds
+537.81 mln.
9.58%
1 janv. 2013
6.201 mds
+49.214 mln.
0.8%
1 janv. 2014
6.517 mds
+316.246 mln.
5.1%
1 janv. 2015
6.687 mds
+169.446 mln.
2.6%
1 janv. 2016
6.633 mds
-53.493 mln.
-0.8%

Classement des pays selon les statistiques actuelles par années