33
/fr/
AIzaSyAYiBZKx7MnpbEhh9jyipgxe19OcubqV5w
August 1, 2025
138442
Georgia
GEO
true
2
1
Net taxes on products (constant LCU)
2016,2015,2014,2013,2012,2011,2010,2009,2008,2007,2006,2005,2004,2003,2002,2001,2000,1999,1998,1997,1996,1995,1994,1993,1992,1991
Download
Bibliothèque de statistiques globales →Georgia →

Net taxes on products (constant LCU)

Cette statistique dans les autres pays:

AfghanistanAlbaniaAlgeriaAntigua and BarbudaArgentinaArmeniaAustraliaAustriaAzerbaijanBahamas, TheBangladeshBelarusBelgiumBelizeBeninBermudaBhutanBoliviaBosnia and HerzegovinaBotswanaBrazilBulgariaBurkina FasoBurundiCabo VerdeCambodiaCameroonCanadaCentral African RepublicChadChileColombiaCongo, Dem. Rep.Costa RicaCroatiaCubaCyprusCzech RepublicDenmarkDjiboutiDominicaDominican RepublicEcuadorEl SalvadorEquatorial GuineaEritreaEstoniaEthiopiaFijiFinlandFranceGabonGambia, TheGeorgiaGermanyGhanaGreeceGrenadaGuatemalaGuineaGuinea-BissauGuyanaHaitiHondurasHong Kong SAR, ChinaHungaryIndiaIndonesiaIran, Islamic Rep.IrelandItalyJamaicaJapanJordanKazakhstanKenyaKiribatiKorea, Rep.KosovoKyrgyz RepublicLao PDRLatviaLebanonLesothoLiberiaLithuaniaLuxembourgMacedonia, FYRMadagascarMalawiMaldivesMaliMarshall IslandsMauritaniaMauritiusMexicoMicronesia, Fed. Sts.MoldovaMongoliaMontenegroMoroccoMozambiqueNamibiaNepalNetherlandsNew ZealandNicaraguaNigerNigeriaNorwayOmanPakistanPalauPanamaPapua New GuineaParaguayPeruPhilippinesPolandPortugalRomaniaRussian FederationRwandaSao Tome and PrincipeSenegalSerbiaSeychellesSierra LeoneSingaporeSlovak RepublicSloveniaSolomon IslandsSomaliaSouth AfricaSpainSri LankaSt. Kitts and NevisSt. LuciaSt. Vincent and the GrenadinesSudanSurinameSwazilandSwedenSwitzerlandTajikistanTanzaniaTimor-LesteTongaTrinidad and TobagoTunisiaTurkeyTuvaluUgandaUkraineUnited Arab EmiratesUnited KingdomUnited StatesUruguayUzbekistanVanuatuVenezuela, RBVietnamWest Bank and GazaZambiaZimbabwe

La ligne de temps

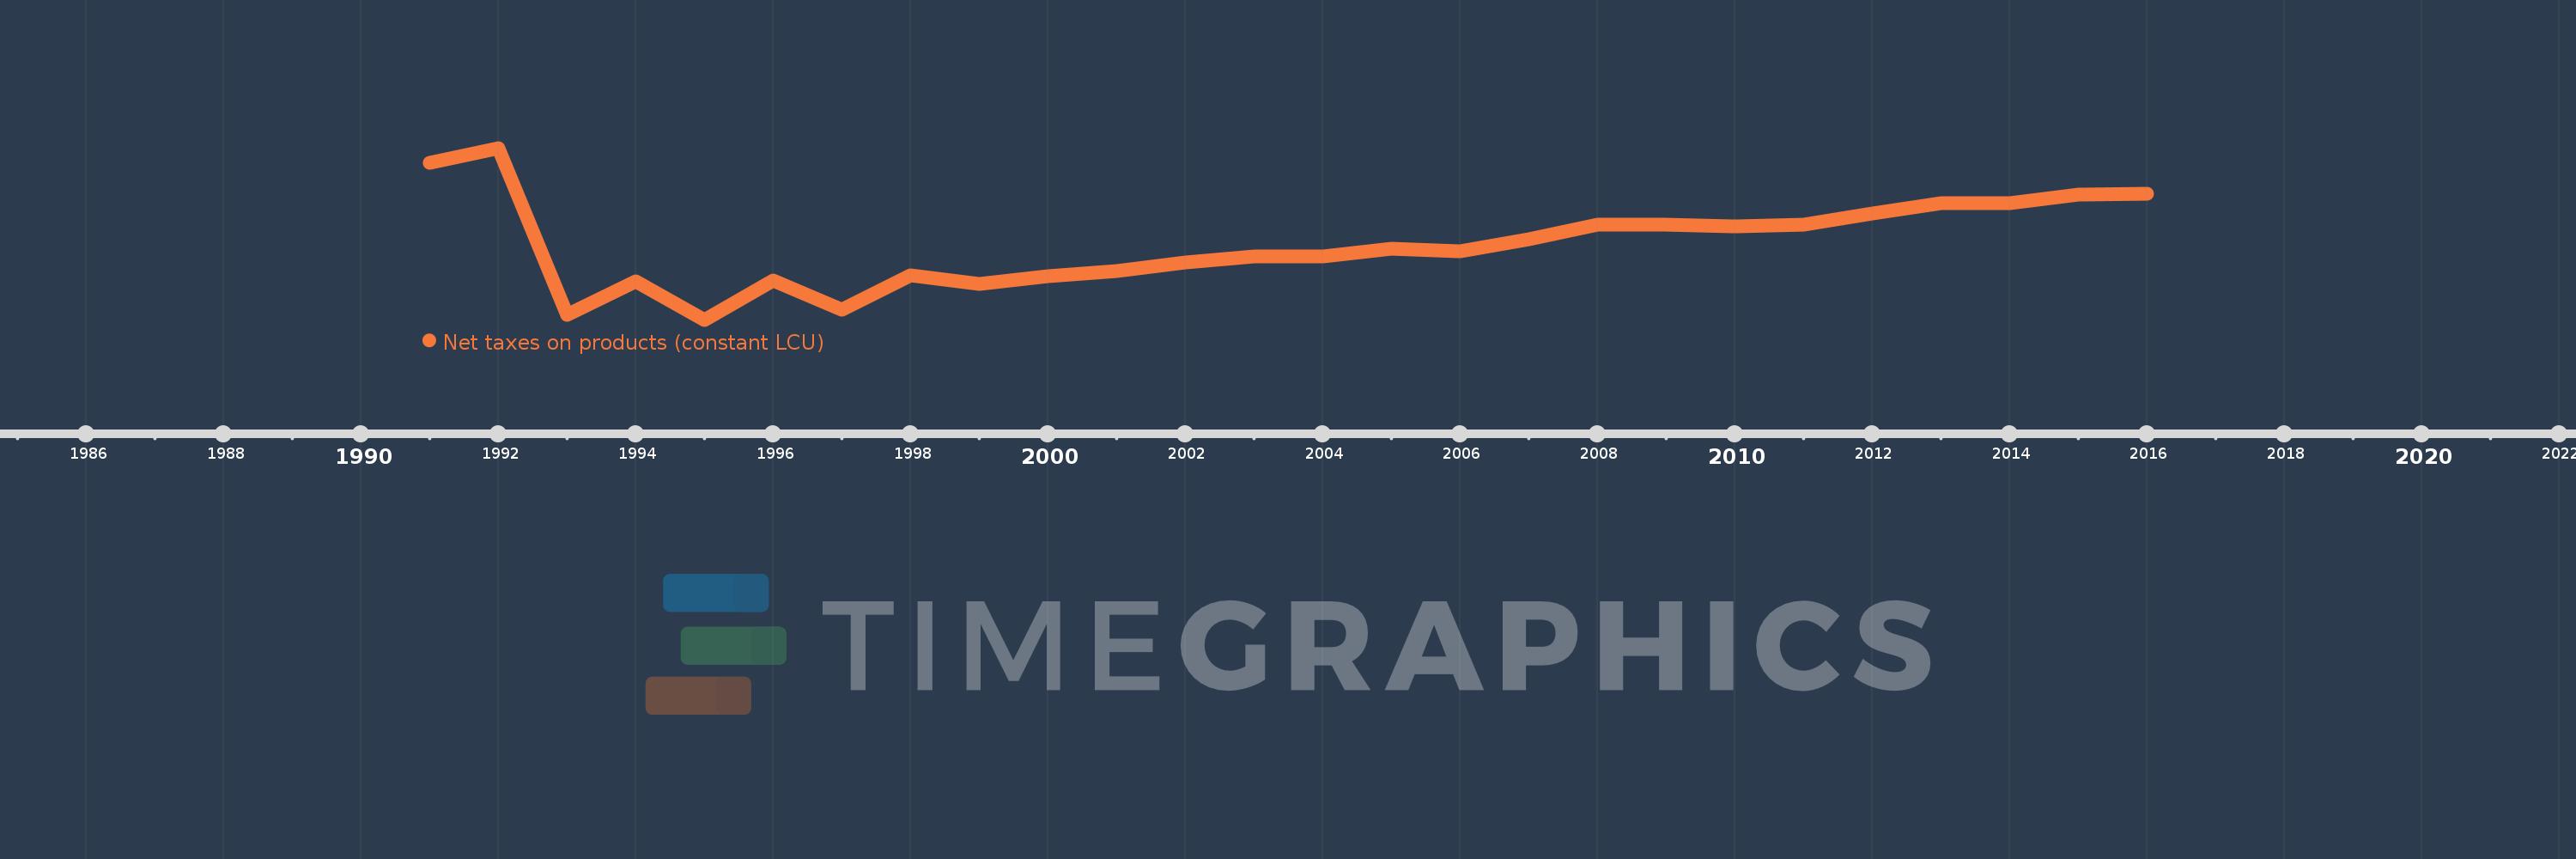
Cette échelle de temps montre un graphique de 1991 année à 2016 année Georgia. Les données jusqu'à 1990 année ne sont pas présentés. Quantité d'observations actuelles selon dates: 26.

Source (désignation):

Les indicateurs du développement mondiale

Source (organisation):

World Bank national accounts data, and OECD National Accounts data files.

Catégories:

Economy & Growth

Dernière mise à jour

23 avr. 2017

Les indicateurs de changement de valeurs selon les années

En moyenne:
378.11 mln.
Minimum:
71.502 mln.
1 janv. 1995
Maximum:
767.857 mln.
1 janv. 1992
Pour la date d''observation
Valeur
Changement absolu
Le changement par rapport à la valeur précédente
1 janv. 1991
707.113 mln.
+707.113 mln.
0.0%
1 janv. 1992
767.857 mln.
+60.744 mln.
8.59%
1 janv. 1993
92.975 mln.
-674.881 mln.
-87.89%
1 janv. 1994
227.284 mln.
+134.308 mln.
144.46%
1 janv. 1995
71.502 mln.
-155.781 mln.
-68.54%
1 janv. 1996
229.452 mln.
+157.95 mln.
220.9%
1 janv. 1997
111.594 mln.
-117.858 mln.
-51.37%
1 janv. 1998
251.309 mln.
+139.715 mln.
125.2%
1 janv. 1999
217.362 mln.
-33.947 mln.
-13.51%
1 janv. 2000
248.788 mln.
+31.426 mln.
14.46%
1 janv. 2001
267.677 mln.
+18.889 mln.
7.59%
1 janv. 2002
303.902 mln.
+36.225 mln.
13.53%
1 janv. 2003
327.099 mln.
+23.197 mln.
7.63%
1 janv. 2004
329.542 mln.
+2.443 mln.
0.75%
1 janv. 2005
359.019 mln.
+29.477 mln.
8.94%
1 janv. 2006
349.645 mln.
-9.375 mln.
-2.61%
1 janv. 2007
396.03 mln.
+46.385 mln.
13.27%
1 janv. 2008
456.782 mln.
+60.753 mln.
15.34%
1 janv. 2009
458.623 mln.
+1.84 mln.
0.4%
1 janv. 2010
449.184 mln.
-9.439 mln.
-2.06%
1 janv. 2011
455.889 mln.
+6.705 mln.
1.49%
1 janv. 2012
502.596 mln.
+46.707 mln.
10.25%
1 janv. 2013
542.411 mln.
+39.814 mln.
7.92%
1 janv. 2014
545.514 mln.
+3.103 mln.
0.57%
1 janv. 2015
578.082 mln.
+32.568 mln.
5.97%
1 janv. 2016
583.632 mln.
+5.55 mln.
0.96%

Classement des pays selon les statistiques actuelles par années