33
/fr/
AIzaSyAYiBZKx7MnpbEhh9jyipgxe19OcubqV5w
August 1, 2025
197925
Moldova
MDA
true
2
1
Net financial account (BoP, current US$)
2016,2015,2014,2013,2012,2011,2010,2009,2008,2007,2006,2005,2004,2003,2002,2001,2000,1999,1998,1997,1996,1995
Download
Bibliothèque de statistiques globales →Moldova →

Net financial account (BoP, current US$)

Cette statistique dans les autres pays:

AfghanistanAlbaniaAlgeriaAngolaAntigua and BarbudaArgentinaArmeniaArubaAustraliaAustriaAzerbaijanBahamas, TheBahrainBangladeshBarbadosBelarusBelgiumBelizeBeninBermudaBhutanBoliviaBosnia and HerzegovinaBotswanaBrazilBrunei DarussalamBulgariaBurkina FasoBurundiCabo VerdeCambodiaCameroonCanadaCentral African RepublicChadChileChinaColombiaComorosCongo, Dem. Rep.Congo, Rep.Costa RicaCote d'IvoireCroatiaCuracaoCyprusCzech RepublicDenmarkDjiboutiDominicaDominican RepublicEcuadorEgypt, Arab Rep.El SalvadorEquatorial GuineaEritreaEstoniaEthiopiaEuro areaFijiFinlandFranceFrench PolynesiaGabonGambia, TheGeorgiaGermanyGhanaGreeceGrenadaGuatemalaGuineaGuinea-BissauGuyanaHaitiHondurasHong Kong SAR, ChinaHungaryIcelandIndiaIndonesiaIran, Islamic Rep.IraqIrelandIsraelItalyJamaicaJapanJordanKazakhstanKenyaKiribatiKorea, Rep.KosovoKuwaitKyrgyz RepublicLao PDRLatviaLebanonLesothoLiberiaLibyaLithuaniaLuxembourgMacao SAR, ChinaMacedonia, FYRMadagascarMalawiMalaysiaMaldivesMaliMaltaMarshall IslandsMauritaniaMauritiusMexicoMicronesia, Fed. Sts.MoldovaMongoliaMontenegroMoroccoMozambiqueMyanmarNamibiaNepalNetherlandsNew CaledoniaNew ZealandNicaraguaNigerNigeriaNorwayOmanPakistanPalauPanamaPapua New GuineaParaguayPeruPhilippinesPolandPortugalQatarRomaniaRussian FederationRwandaSamoaSao Tome and PrincipeSaudi ArabiaSenegalSerbiaSeychellesSierra LeoneSingaporeSint Maarten (Dutch part)Slovak RepublicSloveniaSolomon IslandsSouth AfricaSouth SudanSpainSri LankaSt. Kitts and NevisSt. LuciaSt. Vincent and the GrenadinesSudanSurinameSwazilandSwedenSwitzerlandSyrian Arab RepublicTajikistanTanzaniaThailandTimor-LesteTogoTongaTrinidad and TobagoTunisiaTurkeyTuvaluUgandaUkraineUnited KingdomUnited StatesUruguayVanuatuVenezuela, RBVietnamWest Bank and GazaYemen, Rep.ZambiaZimbabwe

La ligne de temps

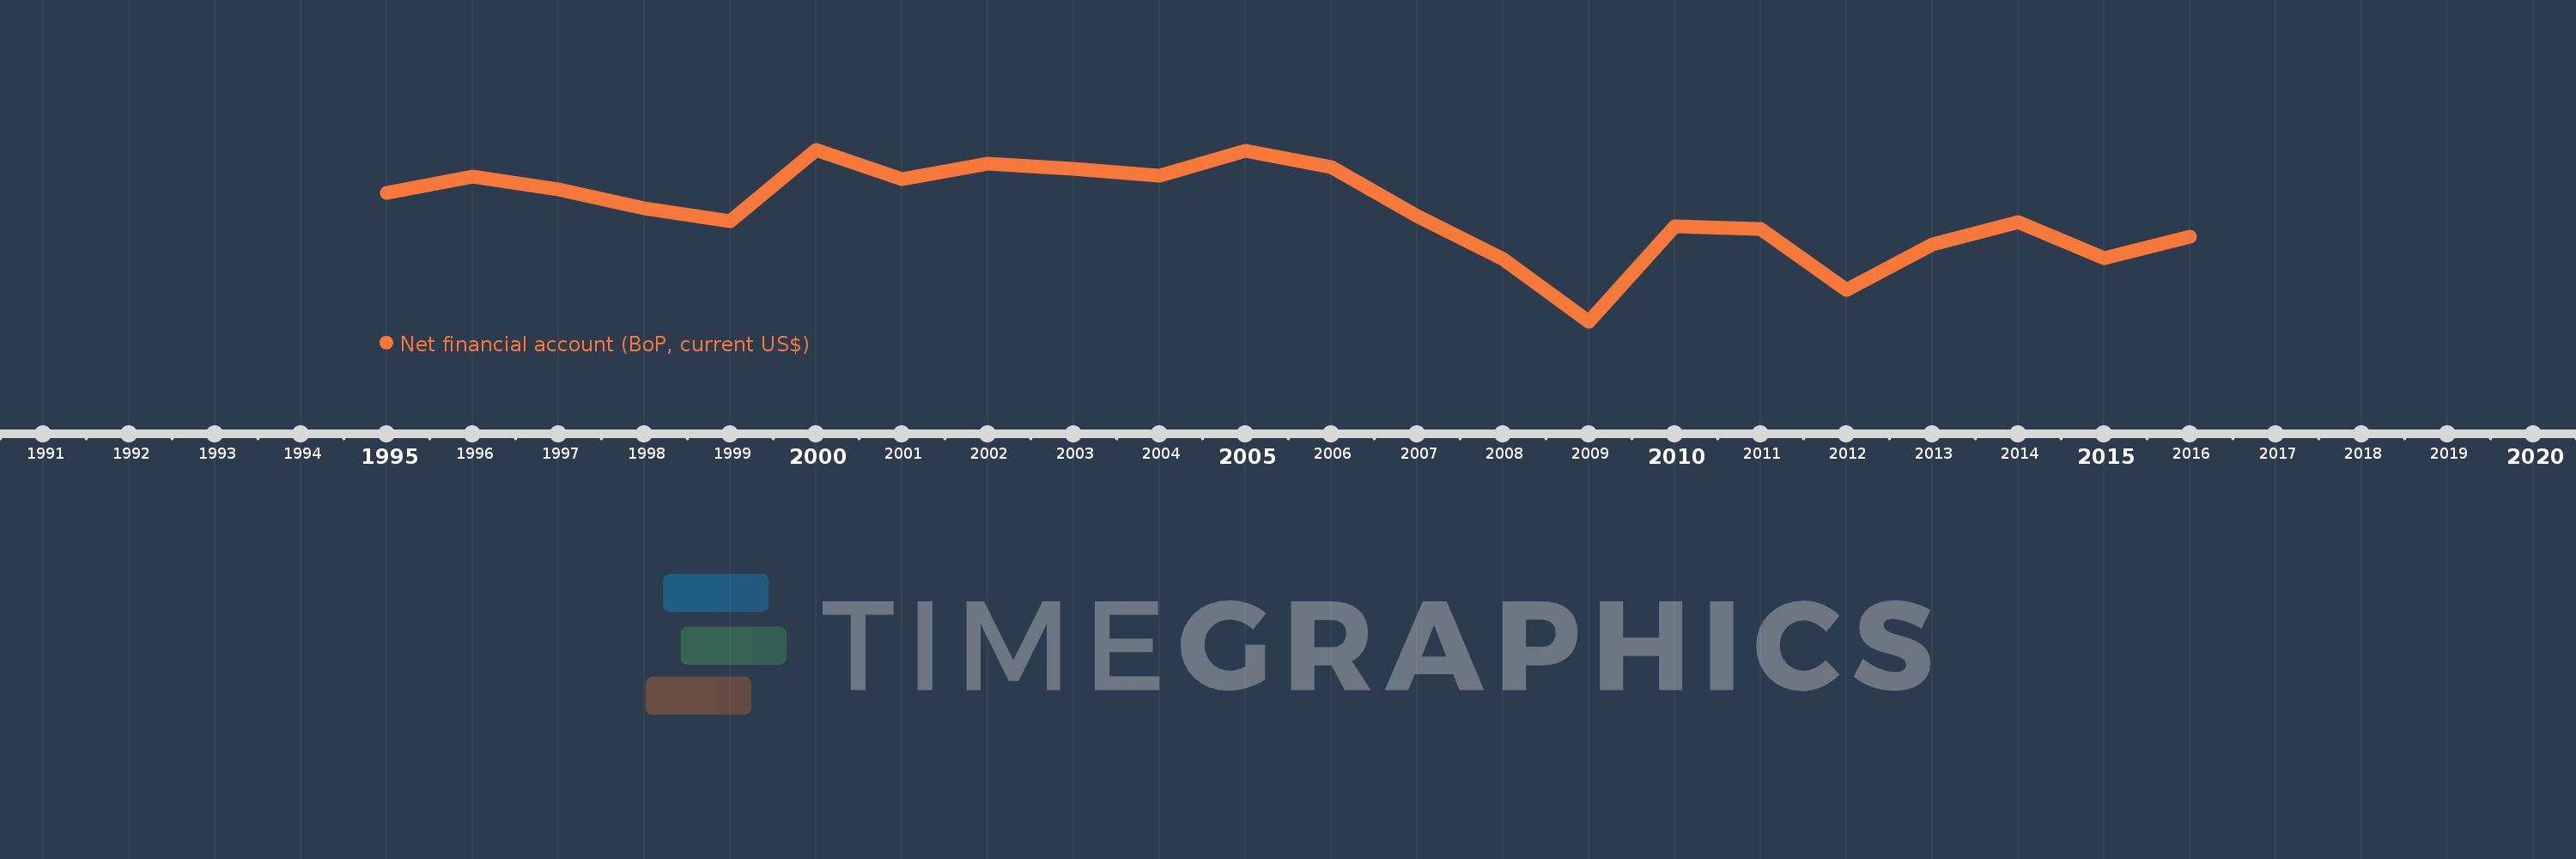
Cette échelle de temps montre un graphique de 1995 année à 2016 année Moldova. Les données jusqu'à 1994 année ne sont pas présentés. Quantité d'observations actuelles selon dates: 22.

Source (désignation):

Les indicateurs du développement mondiale

Source (organisation):

International Monetary Fund, Balance of Payments Statistics Yearbook and data files.

Catégories:

Economy & Growth

Dernière mise à jour

23 avr. 2017

Les indicateurs de changement de valeurs selon les années

En moyenne:
-300.812 mln.
Minimum:
-926.85 mln.
1 janv. 2009
Maximum:
44.28 mln.
1 janv. 2000
Pour la date d''observation
Valeur
Changement absolu
Le changement par rapport à la valeur précédente
1 janv. 1995
-196.969 mln.
-196.969 mln.
0.0%
1 janv. 1996
-102.55 mln.
+94.419 mln.
-47.94%
1 janv. 1997
-176.7 mln.
-74.15 mln.
72.31%
1 janv. 1998
-282.97 mln.
-106.27 mln.
60.14%
1 janv. 1999
-357.21 mln.
-74.24 mln.
26.24%
1 janv. 2000
44.28 mln.
+401.49 mln.
-112.4%
1 janv. 2001
-118.89 mln.
-163.17 mln.
-368.5%
1 janv. 2002
-31.41 mln.
+87.48 mln.
-73.58%
1 janv. 2003
-63.17 mln.
-31.76 mln.
101.11%
1 janv. 2004
-101.66 mln.
-38.49 mln.
60.93%
1 janv. 2005
41.73 mln.
+143.39 mln.
-141.05%
1 janv. 2006
-51.39 mln.
-93.12 mln.
-223.15%
1 janv. 2007
-327.18 mln.
-275.79 mln.
536.66%
1 janv. 2008
-571.27 mln.
-244.09 mln.
74.6%
1 janv. 2009
-926.85 mln.
-355.58 mln.
62.24%
1 janv. 2010
-388.09 mln.
+538.76 mln.
-58.13%
1 janv. 2011
-402.19 mln.
-14.1 mln.
3.63%
1 janv. 2012
-747.14 mln.
-344.95 mln.
85.77%
1 janv. 2013
-487.61 mln.
+259.53 mln.
-34.74%
1 janv. 2014
-363.25 mln.
+124.36 mln.
-25.5%
1 janv. 2015
-563.66 mln.
-200.41 mln.
55.17%
1 janv. 2016
-443.72 mln.
+119.94 mln.
-21.28%

Classement des pays selon les statistiques actuelles par années