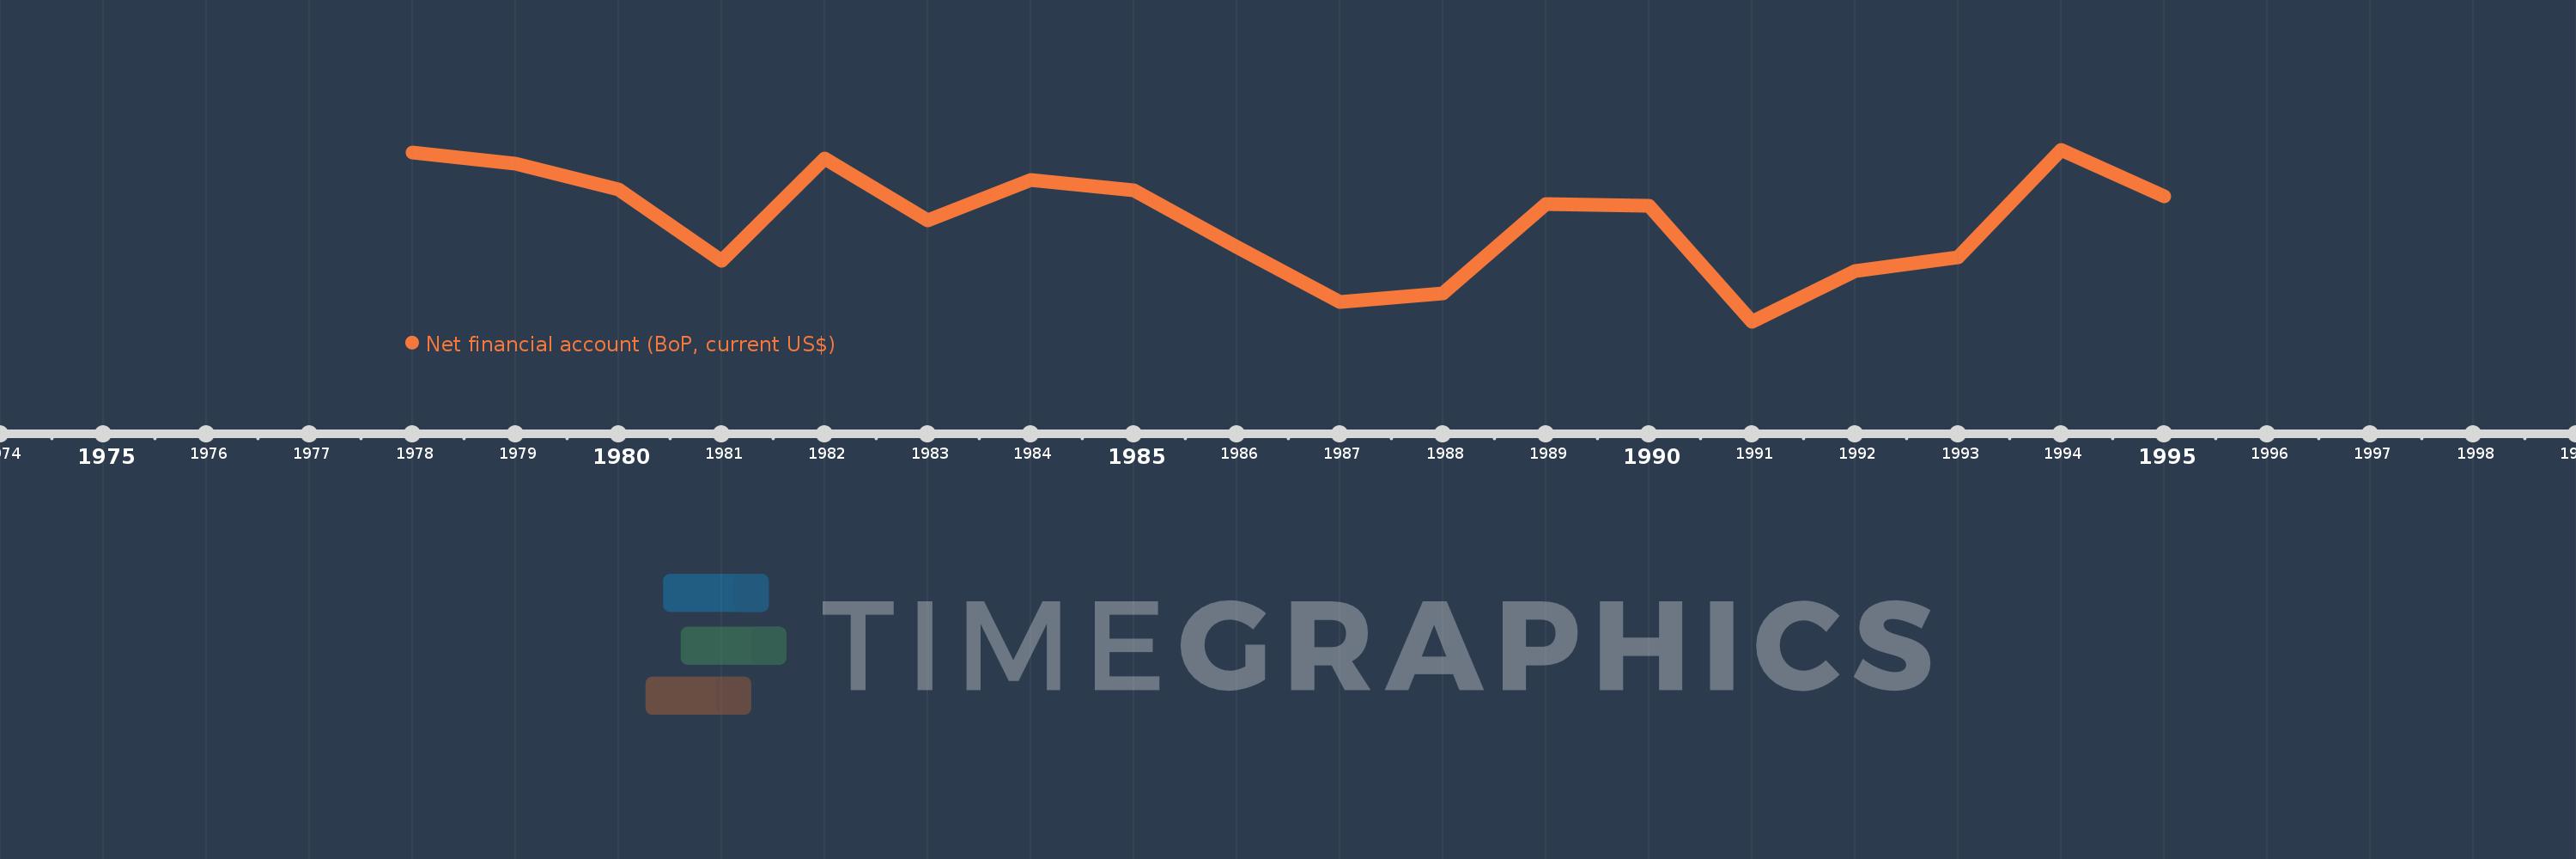
Cette échelle de temps montre un graphique de 1978 année à 1995 année Central African Republic. Les données jusqu'à 1977 année ne sont pas présentés. Quantité d'observations actuelles selon dates: 18.
Source (désignation):
Les indicateurs du développement mondiale
Source (organisation):
International Monetary Fund, Balance of Payments Statistics Yearbook and data files.
Catégories:
Economy & Growth
Dernière mise à jour
23 avr. 2017
Les indicateurs de changement de valeurs selon les années
En moyenne:
-40.218 mln.
Minimum:
-86.271 mln.
1 janv. 1991
Maximum:
-8.62 mln.
1 janv. 1994
Pour la date d''observation
Valeur
Changement absolu
Le changement par rapport à la valeur précédente
1 janv. 1978
-9.476 mln.
-9.476 mln.
0.0%
1 janv. 1979
-14.602 mln.
-5.126 mln.
54.1%
1 janv. 1980
-26.438 mln.
-11.836 mln.
81.06%
1 janv. 1981
-58.42 mln.
-31.982 mln.
120.97%
1 janv. 1982
-12.353 mln.
+46.067 mln.
-78.85%
1 janv. 1983
-40.214 mln.
-27.86 mln.
225.53%
1 janv. 1984
-21.975 mln.
+18.238 mln.
-45.35%
1 janv. 1985
-26.616 mln.
-4.641 mln.
21.12%
1 janv. 1986
-52.215 mln.
-25.599 mln.
96.18%
1 janv. 1987
-77.313 mln.
-25.098 mln.
48.07%
1 janv. 1988
-73.368 mln.
+3.945 mln.
-5.1%
1 janv. 1989
-32.94 mln.
+40.428 mln.
-55.1%
1 janv. 1990
-33.635 mln.
-695.558 milles
2.11%
1 janv. 1991
-86.271 mln.
-52.635 mln.
156.49%
1 janv. 1992
-63.235 mln.
+23.036 mln.
-26.7%
1 janv. 1993
-56.877 mln.
+6.357 mln.
-10.05%
1 janv. 1994
-8.62 mln.
+48.257 mln.
-84.84%
1 janv. 1995
-29.359 mln.
-20.738 mln.
240.58%
Classement des pays selon les statistiques actuelles par années