29
/fr/
fr
AIzaSyAYiBZKx7MnpbEhh9jyipgxe19OcubqV5w
April 1, 2024
197825
Moldova
MDA
true
2
1
Manufacturing, value added (constant LCU)
2016,2015,2014,2013,2012,2011,2010,2009,2008,2007,2006,2005,2004,2003,2002,2001,2000,1999,1998,1997,1996
Download
Bibliothèque de statistiques globales →Moldova →

Manufacturing, value added (constant LCU)

Cette statistique dans les autres pays:
AfghanistanAlbaniaAlgeriaAntigua and BarbudaArgentinaArmeniaAustraliaAustriaAzerbaijanBahamas, TheBahrainBangladeshBelarusBelgiumBelizeBeninBermudaBhutanBoliviaBosnia and HerzegovinaBotswanaBrazilBrunei DarussalamBurkina FasoBurundiCabo VerdeCambodiaCameroonCanadaCayman IslandsCentral African RepublicChadChileColombiaComorosCongo, Dem. Rep.Congo, Rep.Costa RicaCote d'IvoireCroatiaCubaCyprusCzech RepublicDenmarkDjiboutiDominicaDominican RepublicEcuadorEgypt, Arab Rep.El SalvadorEquatorial GuineaEritreaEstoniaEthiopiaFijiFinlandFranceGabonGambia, TheGeorgiaGermanyGhanaGreeceGrenadaGuatemalaGuineaGuyanaHaitiHondurasHong Kong SAR, ChinaHungaryIcelandIndiaIndonesiaIran, Islamic Rep.IraqIrelandItalyJamaicaJapanJordanKazakhstanKenyaKiribatiKorea, Rep.KosovoKuwaitKyrgyz RepublicLao PDRLatviaLebanonLesothoLiberiaLibyaLithuaniaLuxembourgMacedonia, FYRMadagascarMalawiMalaysiaMaldivesMarshall IslandsMauritaniaMauritiusMexicoMicronesia, Fed. Sts.MoldovaMongoliaMontenegroMoroccoMozambiqueMyanmarNamibiaNepalNetherlandsNew ZealandNicaraguaNigerNigeriaNorwayOmanPakistanPalauPanamaPapua New GuineaParaguayPeruPhilippinesPolandPortugalPuerto RicoQatarRomaniaRussian FederationRwandaSamoaSao Tome and PrincipeSaudi ArabiaSenegalSerbiaSeychellesSierra LeoneSingaporeSlovak RepublicSloveniaSolomon IslandsSomaliaSouth AfricaSpainSri LankaSt. Kitts and NevisSt. LuciaSt. Vincent and the GrenadinesSudanSurinameSwazilandSwedenSwitzerlandSyrian Arab RepublicTajikistanTanzaniaThailandTimor-LesteTogoTongaTrinidad and TobagoTunisiaTurkeyTuvaluUgandaUkraineUnited Arab EmiratesUnited KingdomUnited StatesUruguayUzbekistanVanuatuVenezuela, RBVietnamWest Bank and GazaZambiaZimbabwe
La ligne de temps
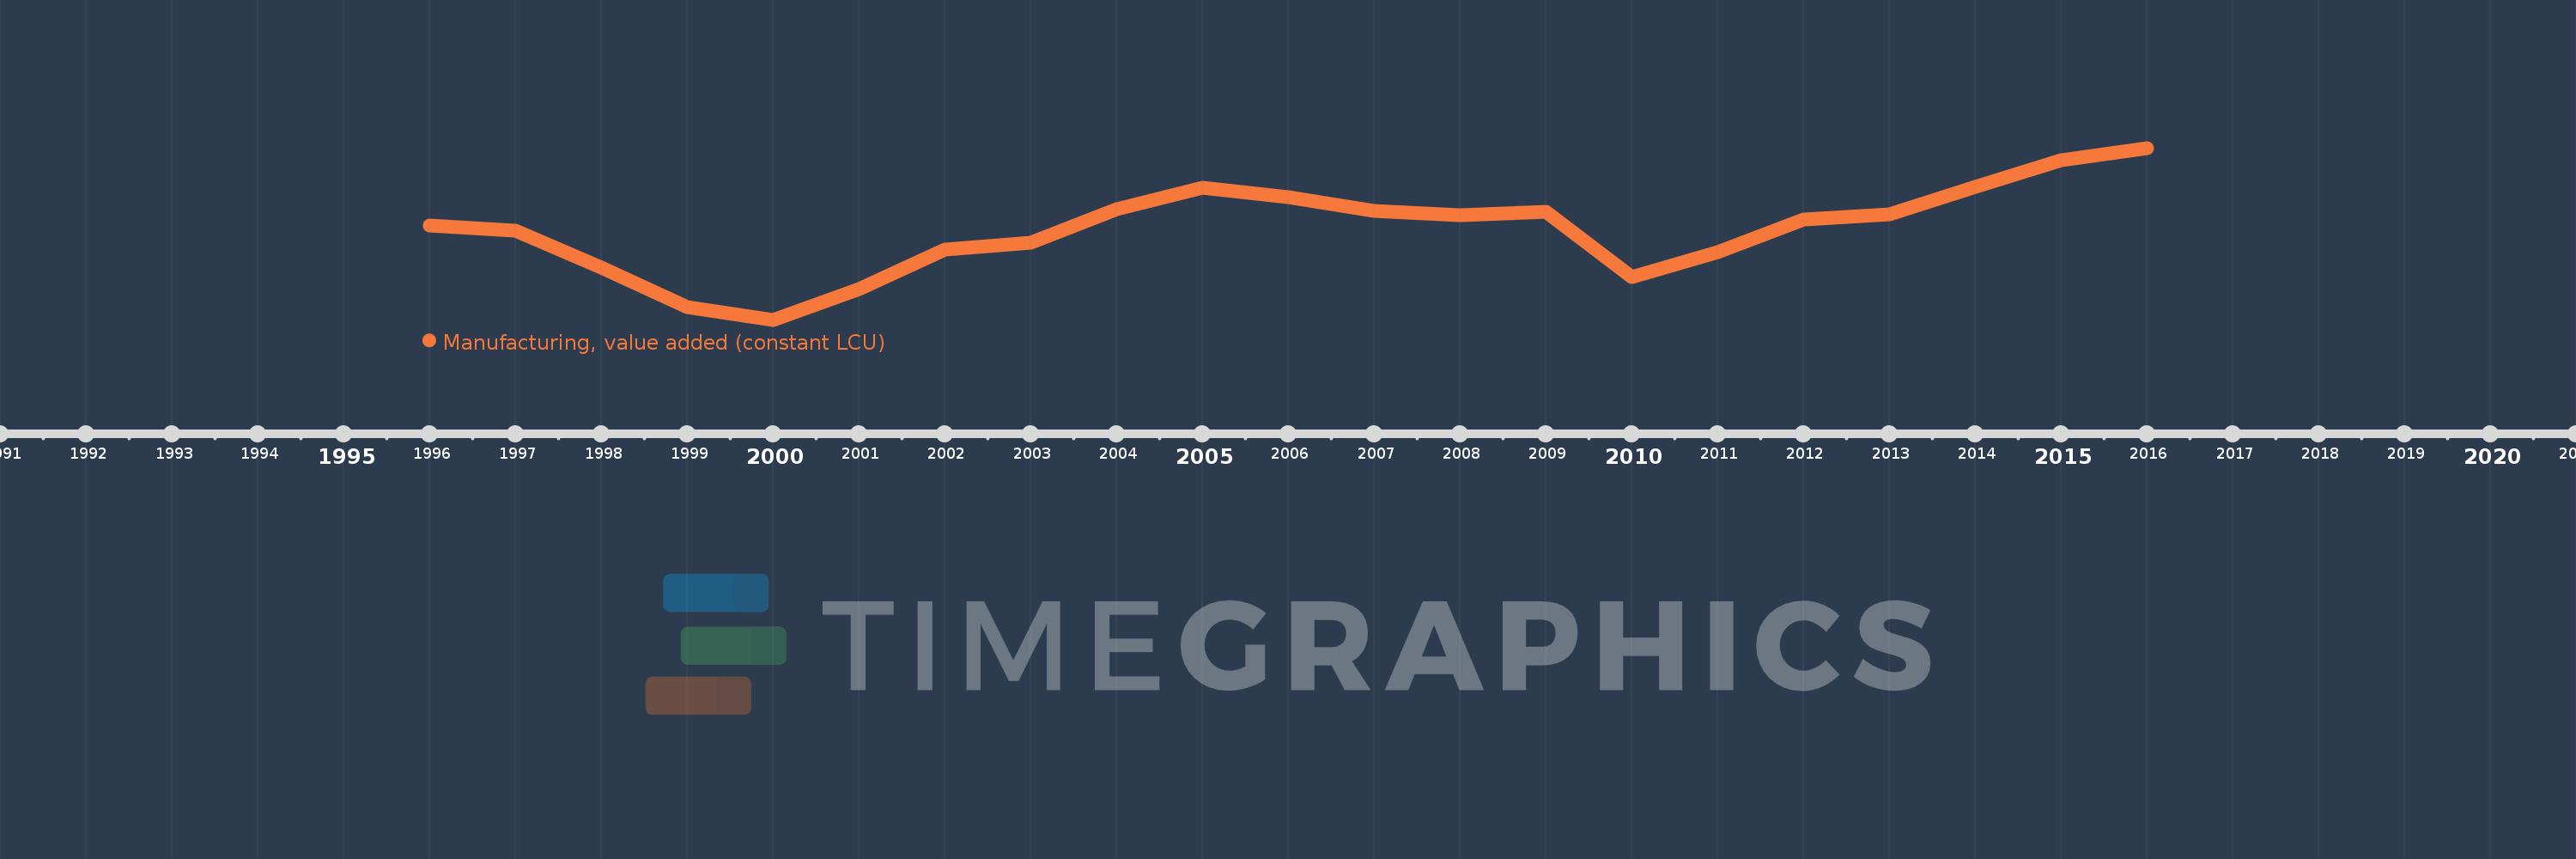
Cette échelle de temps montre un graphique de 1996 année à 2016 année Moldova. Les données jusqu'à 1995 année ne sont pas présentés. Quantité d'observations actuelles selon dates: 21.
Source (désignation):
Les indicateurs du développement mondiale
Source (organisation):
World Bank national accounts data, and OECD National Accounts data files.
Catégories:
Economy & Growth
Dernière mise à jour
23 avr. 2017
Les indicateurs de changement de valeurs selon les années
En moyenne:
1.645 mds
Minimum:
1.117 mds
1 janv. 2000
Maximum:
2.124 mds
1 janv. 2016
Pour la date d''observation
Valeur
Changement absolu
Le changement par rapport à la valeur précédente
1 janv. 1996
1.667 mds
+1.667 mds
0.0%
1 janv. 1997
1.639 mds
-28.3 mln.
-1.7%
1 janv. 1998
1.423 mds
-216.3 mln.
-13.2%
1 janv. 1999
1.19 mds
-233.1 mln.
-16.38%
1 janv. 2000
1.117 mds
-72.3 mln.
-6.08%
1 janv. 2001
1.296 mds
+178.1 mln.
15.94%
1 janv. 2002
1.526 mds
+230.8 mln.
17.81%
1 janv. 2003
1.567 mds
+40.131 mln.
2.63%
1 janv. 2004
1.765 mds
+198.447 mln.
12.67%
1 janv. 2005
1.89 mds
+125.129 mln.
7.09%
1 janv. 2006
1.833 mds
-57.107 mln.
-3.02%
1 janv. 2007
1.754 mds
-79.0 mln.
-4.31%
1 janv. 2008
1.732 mds
-22.0 mln.
-1.25%
1 janv. 2009
1.752 mds
+20.0 mln.
1.15%
1 janv. 2010
1.368 mds
-384.0 mln.
-21.92%
1 janv. 2011
1.515 mds
+147.0 mln.
10.75%
1 janv. 2012
1.706 mds
+190.89 mln.
12.6%
1 janv. 2013
1.737 mds
+30.706 mln.
1.8%
1 janv. 2014
1.896 mds
+159.767 mln.
9.2%
1 janv. 2015
2.05 mds
+153.605 mln.
8.1%
1 janv. 2016
2.124 mds
+73.799 mln.
3.6%
Classement des pays selon les statistiques actuelles par années

Commentaires:

Envoyer
PremiumAbout & FeedbackUn accordConfidentialité
logo
© 2022 Selected Technologies LLC – Morgan Hill, California