29
/fr/
fr
AIzaSyAYiBZKx7MnpbEhh9jyipgxe19OcubqV5w
April 1, 2024
182312
Luxembourg
LUX
true
2
1
Manufacturing, value added (constant LCU)
2016,2015,2014,2013,2012,2011,2010,2009,2008,2007,2006,2005,2004,2003,2002,2001,2000,1999,1998,1997,1996
Download
Bibliothèque de statistiques globales →Luxembourg →

Manufacturing, value added (constant LCU)

Cette statistique dans les autres pays:
AfghanistanAlbaniaAlgeriaAntigua and BarbudaArgentinaArmeniaAustraliaAustriaAzerbaijanBahamas, TheBahrainBangladeshBelarusBelgiumBelizeBeninBermudaBhutanBoliviaBosnia and HerzegovinaBotswanaBrazilBrunei DarussalamBurkina FasoBurundiCabo VerdeCambodiaCameroonCanadaCayman IslandsCentral African RepublicChadChileColombiaComorosCongo, Dem. Rep.Congo, Rep.Costa RicaCote d'IvoireCroatiaCubaCyprusCzech RepublicDenmarkDjiboutiDominicaDominican RepublicEcuadorEgypt, Arab Rep.El SalvadorEquatorial GuineaEritreaEstoniaEthiopiaFijiFinlandFranceGabonGambia, TheGeorgiaGermanyGhanaGreeceGrenadaGuatemalaGuineaGuyanaHaitiHondurasHong Kong SAR, ChinaHungaryIcelandIndiaIndonesiaIran, Islamic Rep.IraqIrelandItalyJamaicaJapanJordanKazakhstanKenyaKiribatiKorea, Rep.KosovoKuwaitKyrgyz RepublicLao PDRLatviaLebanonLesothoLiberiaLibyaLithuaniaLuxembourgMacedonia, FYRMadagascarMalawiMalaysiaMaldivesMarshall IslandsMauritaniaMauritiusMexicoMicronesia, Fed. Sts.MoldovaMongoliaMontenegroMoroccoMozambiqueMyanmarNamibiaNepalNetherlandsNew ZealandNicaraguaNigerNigeriaNorwayOmanPakistanPalauPanamaPapua New GuineaParaguayPeruPhilippinesPolandPortugalPuerto RicoQatarRomaniaRussian FederationRwandaSamoaSao Tome and PrincipeSaudi ArabiaSenegalSerbiaSeychellesSierra LeoneSingaporeSlovak RepublicSloveniaSolomon IslandsSomaliaSouth AfricaSpainSri LankaSt. Kitts and NevisSt. LuciaSt. Vincent and the GrenadinesSudanSurinameSwazilandSwedenSwitzerlandSyrian Arab RepublicTajikistanTanzaniaThailandTimor-LesteTogoTongaTrinidad and TobagoTunisiaTurkeyTuvaluUgandaUkraineUnited Arab EmiratesUnited KingdomUnited StatesUruguayUzbekistanVanuatuVenezuela, RBVietnamWest Bank and GazaZambiaZimbabwe
La ligne de temps
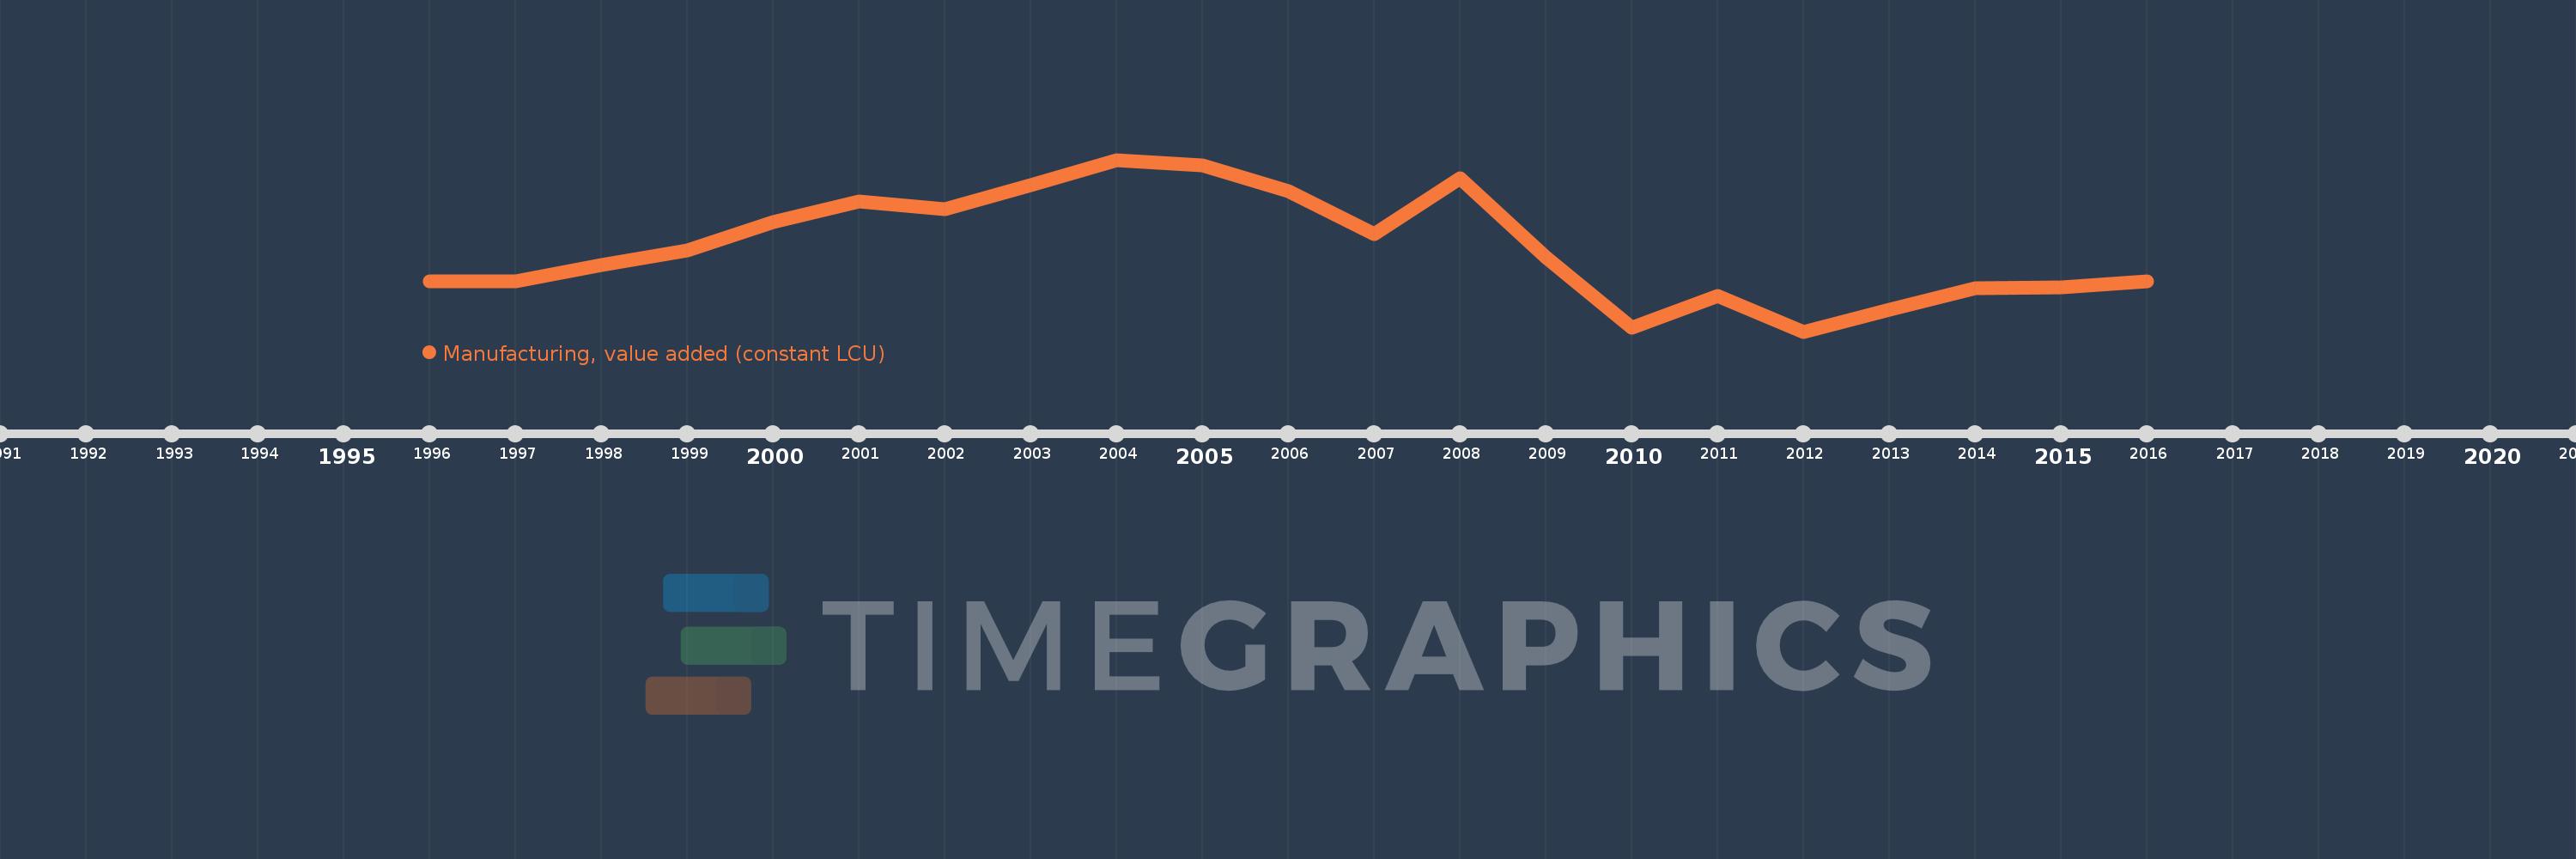
Cette échelle de temps montre un graphique de 1996 année à 2016 année Luxembourg. Les données jusqu'à 1995 année ne sont pas présentés. Quantité d'observations actuelles selon dates: 21.
Source (désignation):
Les indicateurs du développement mondiale
Source (organisation):
World Bank national accounts data, and OECD National Accounts data files.
Catégories:
Economy & Growth
Dernière mise à jour
23 avr. 2017
Les indicateurs de changement de valeurs selon les années
En moyenne:
2.461 mds
Minimum:
1.814 mds
1 janv. 2012
Maximum:
3.14 mds
1 janv. 2004
Pour la date d''observation
Valeur
Changement absolu
Le changement par rapport à la valeur précédente
1 janv. 1996
2.199 mds
+2.199 mds
0.0%
1 janv. 1997
2.203 mds
+3.651 mln.
0.17%
1 janv. 1998
2.331 mds
+128.38 mln.
5.83%
1 janv. 1999
2.439 mds
+108.095 mln.
4.64%
1 janv. 2000
2.657 mds
+218.181 mln.
8.95%
1 janv. 2001
2.821 mds
+163.376 mln.
6.15%
1 janv. 2002
2.762 mds
-58.336 mln.
-2.07%
1 janv. 2003
2.946 mds
+183.7 mln.
6.65%
1 janv. 2004
3.14 mds
+194.6 mln.
6.61%
1 janv. 2005
3.101 mds
-39.9 mln.
-1.27%
1 janv. 2006
2.901 mds
-199.5 mln.
-6.43%
1 janv. 2007
2.568 mds
-333.0 mln.
-11.48%
1 janv. 2008
3.0 mds
+431.7 mln.
16.81%
1 janv. 2009
2.384 mds
-615.4 mln.
-20.51%
1 janv. 2010
1.846 mds
-538.6 mln.
-22.59%
1 janv. 2011
2.088 mds
+242.0 mln.
13.11%
1 janv. 2012
1.814 mds
-273.9 mln.
-13.12%
1 janv. 2013
1.985 mds
+171.2 mln.
9.44%
1 janv. 2014
2.147 mds
+162.1 mln.
8.17%
1 janv. 2015
2.156 mds
+8.4 mln.
0.39%
1 janv. 2016
2.203 mds
+47.0 mln.
2.18%
Classement des pays selon les statistiques actuelles par années

Commentaires:

Envoyer
PremiumAbout & FeedbackUn accordConfidentialité
logo
© 2022 Selected Technologies LLC – Morgan Hill, California