33
/fr/
AIzaSyB4mHJ5NPEv-XzF7P6NDYXjlkCWaeKw5bc
November 1, 2025
186759
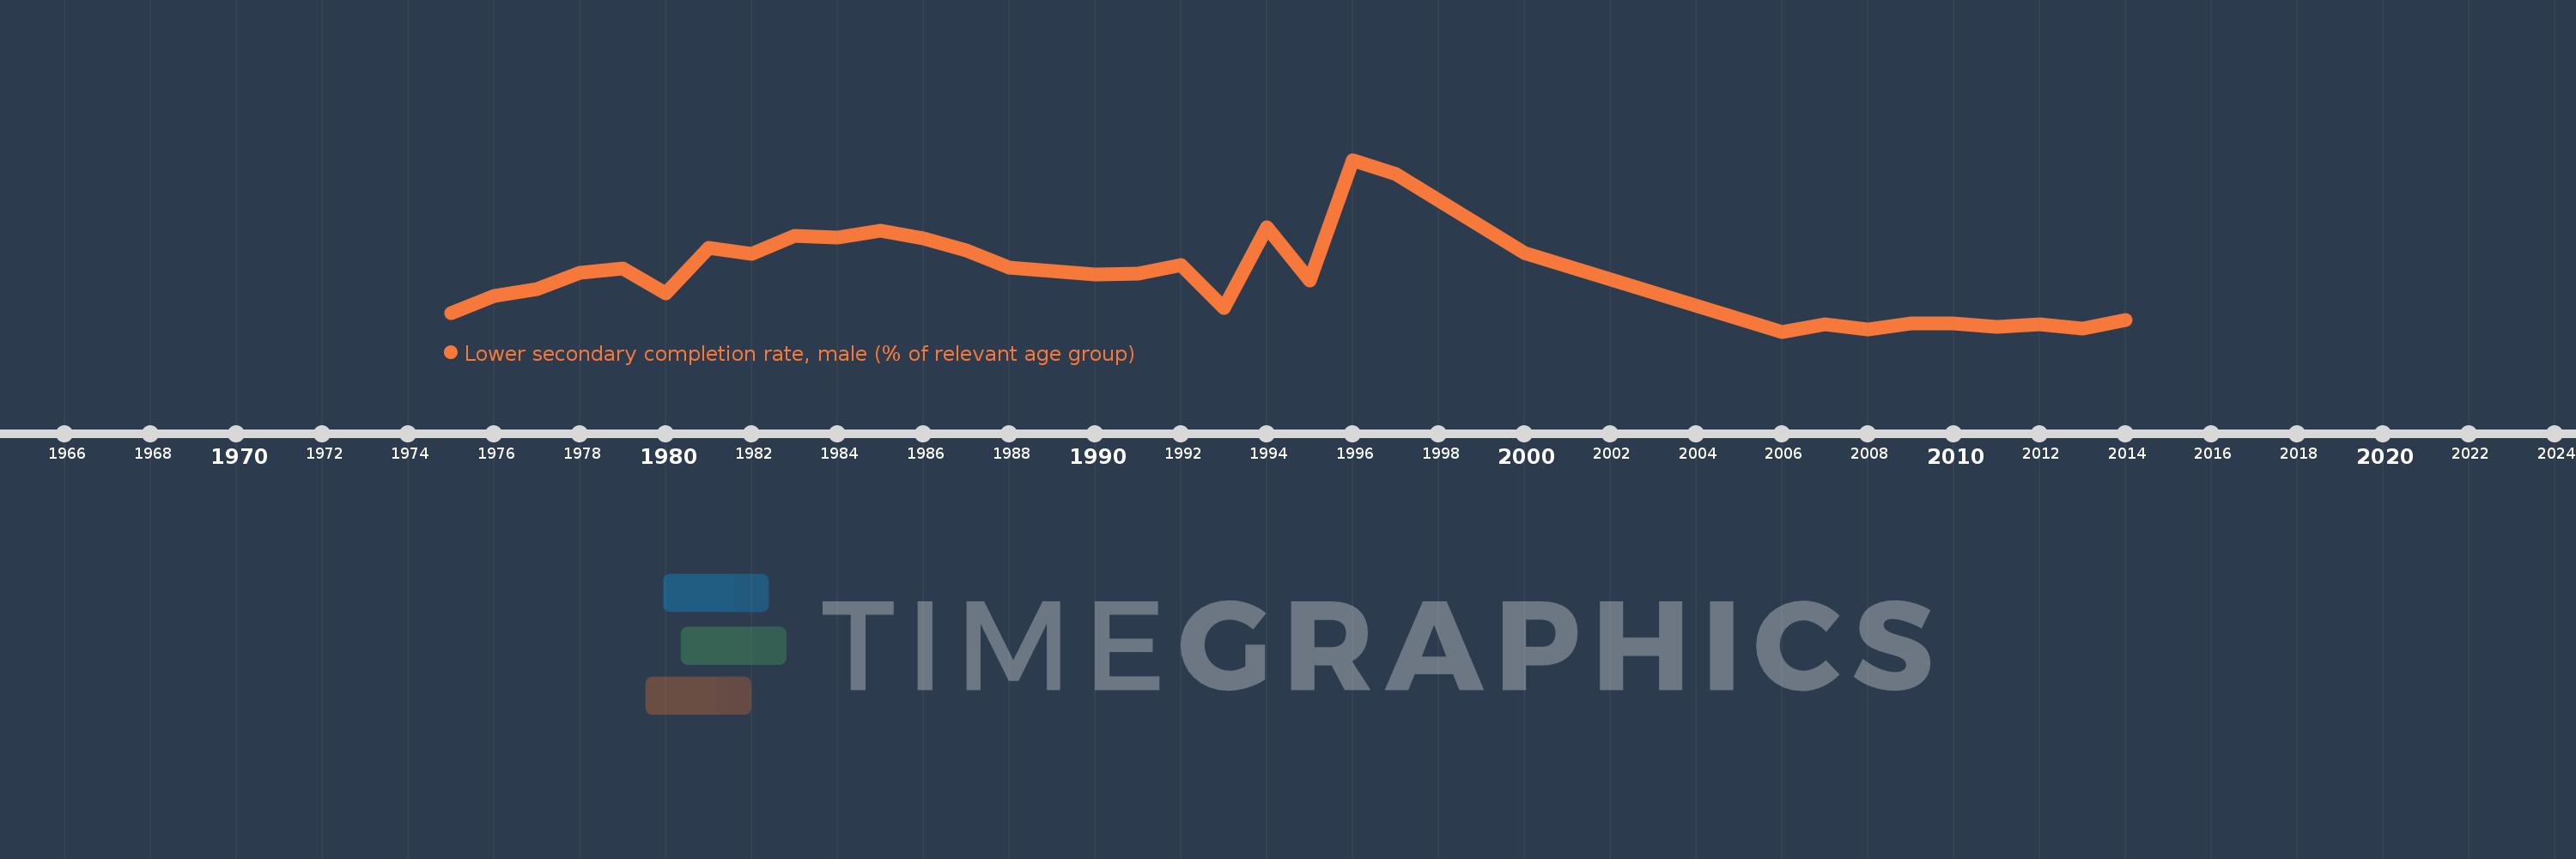
Malawi
MWI
true
2
1
Lower secondary completion rate, male (% of relevant age group)
2014,2013,2012,2011,2010,2009,2008,2007,2006,2000,1997,1996,1995,1994,1993,1992,1991,1990,1989,1988,1987,1986,1985,1984,1983,1982,1981,1980,1979,1978,1977,1976,1975