33
/fr/
AIzaSyB4mHJ5NPEv-XzF7P6NDYXjlkCWaeKw5bc
November 30, 2025
123756
Ecuador
ECU
true
2
1
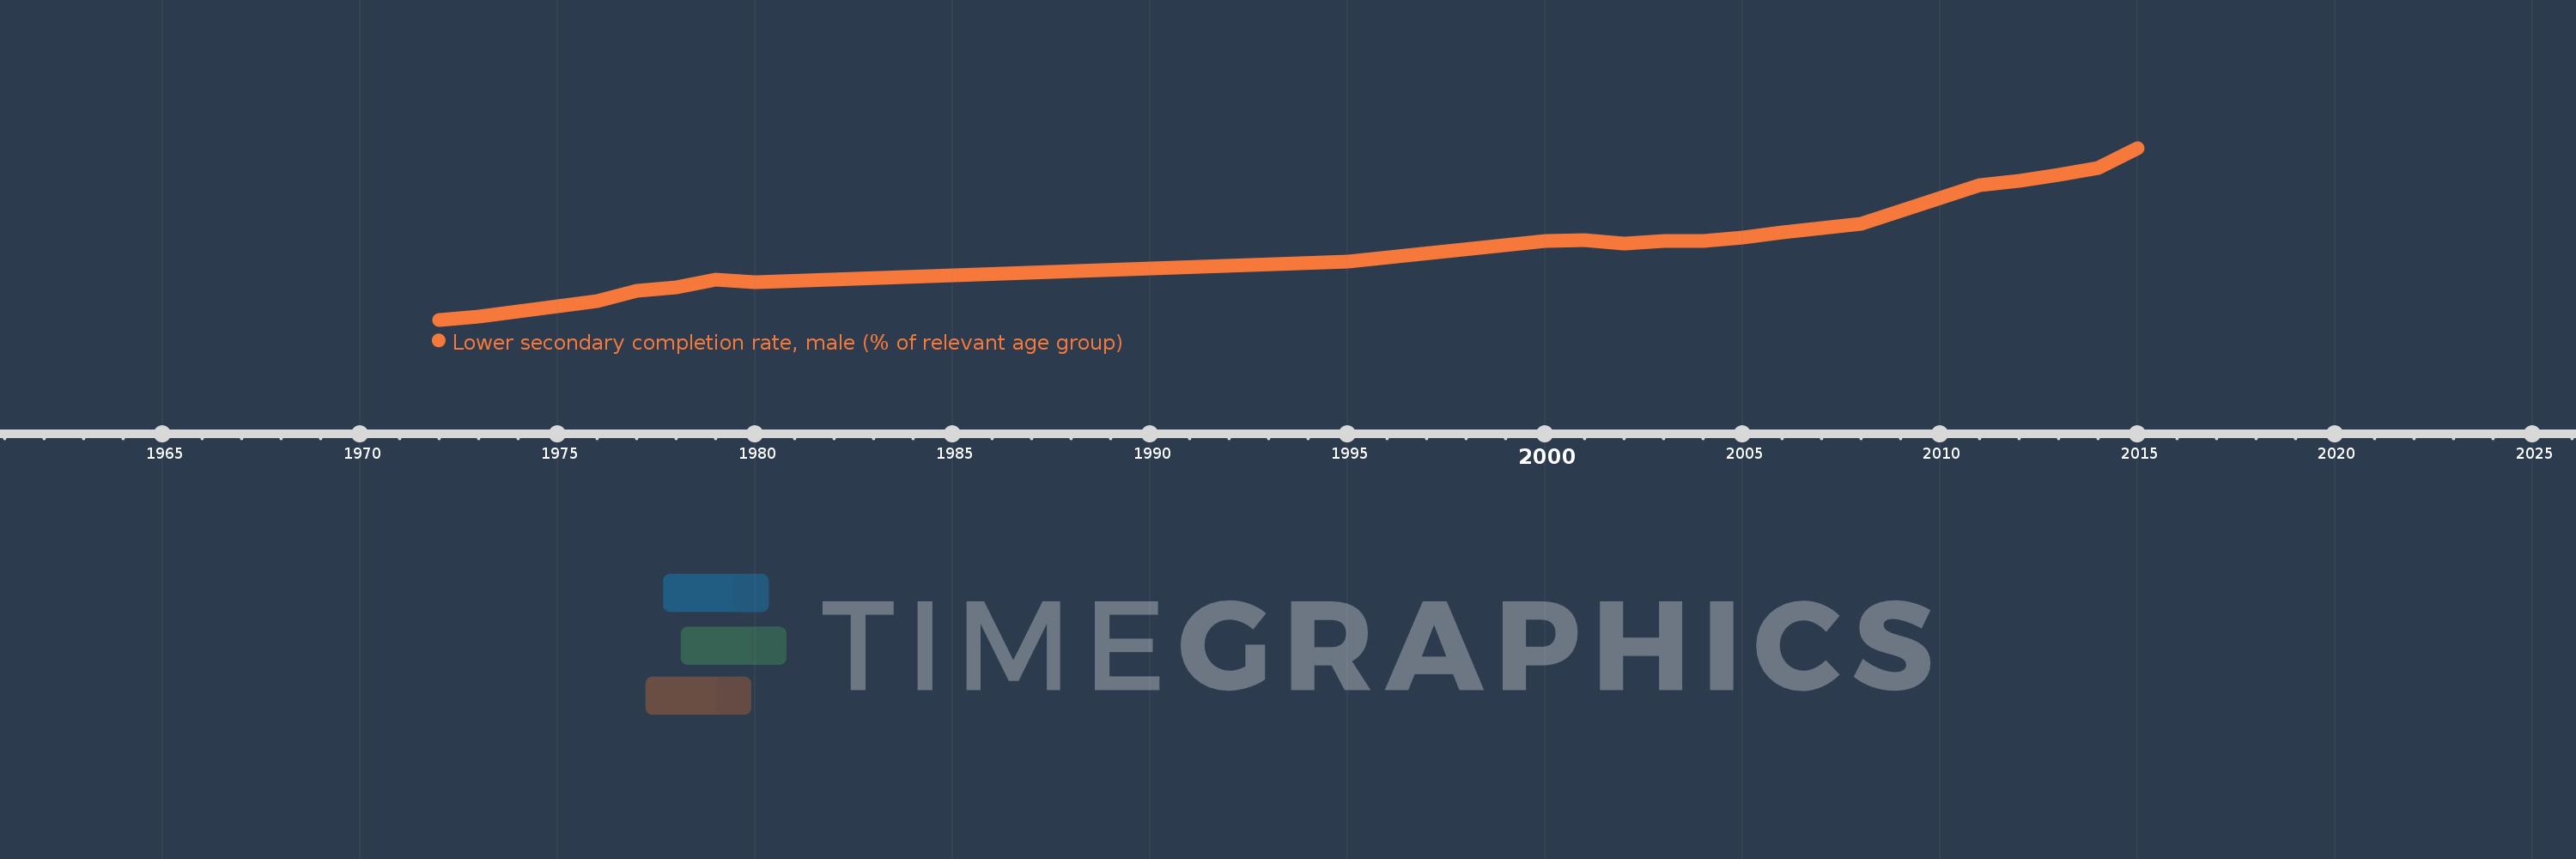
Lower secondary completion rate, male (% of relevant age group)
2015,2014,2013,2012,2011,2008,2007,2006,2005,2004,2003,2002,2001,2000,1995,1980,1979,1978,1977,1976,1973,1972