29
/fr/
fr
AIzaSyAYiBZKx7MnpbEhh9jyipgxe19OcubqV5w
April 1, 2024
183685
Macedonia, FYR
MKD
true
2
1
Current account balance (BoP, current US$)
2016,2015,2014,2013,2012,2011,2010,2009,2008,2007,2006,2005,2004,2003,2002,2001,2000,1999,1998,1997
Download
Bibliothèque de statistiques globales →Macedonia, FYR →

Current account balance (BoP, current US$)

Cette statistique dans les autres pays:
AfghanistanAlbaniaAlgeriaAngolaAntigua and BarbudaArgentinaArmeniaArubaAustraliaAustriaAzerbaijanBahamas, TheBahrainBangladeshBarbadosBelarusBelgiumBelizeBeninBermudaBhutanBoliviaBosnia and HerzegovinaBotswanaBrazilBrunei DarussalamBulgariaBurkina FasoBurundiCabo VerdeCambodiaCameroonCanadaCentral African RepublicChadChileChinaColombiaComorosCongo, Dem. Rep.Congo, Rep.Costa RicaCote d'IvoireCroatiaCuracaoCyprusCzech RepublicDenmarkDjiboutiDominicaDominican RepublicEcuadorEgypt, Arab Rep.El SalvadorEquatorial GuineaEritreaEstoniaEthiopiaEuro areaFaroe IslandsFijiFinlandFranceFrench PolynesiaGabonGambia, TheGeorgiaGermanyGhanaGreeceGrenadaGuatemalaGuineaGuinea-BissauGuyanaHaitiHondurasHong Kong SAR, ChinaHungaryIcelandIndiaIndonesiaIran, Islamic Rep.IraqIrelandIsraelItalyJamaicaJapanJordanKazakhstanKenyaKiribatiKorea, Rep.KosovoKuwaitKyrgyz RepublicLao PDRLatviaLebanonLesothoLiberiaLibyaLithuaniaLuxembourgMacao SAR, ChinaMacedonia, FYRMadagascarMalawiMalaysiaMaldivesMaliMaltaMarshall IslandsMauritaniaMauritiusMexicoMicronesia, Fed. Sts.MoldovaMongoliaMontenegroMoroccoMozambiqueMyanmarNamibiaNepalNetherlandsNew CaledoniaNew ZealandNicaraguaNigerNigeriaNorwayOmanPakistanPalauPanamaPapua New GuineaParaguayPeruPhilippinesPolandPortugalQatarRomaniaRussian FederationRwandaSamoaSao Tome and PrincipeSaudi ArabiaSenegalSerbiaSeychellesSierra LeoneSingaporeSint Maarten (Dutch part)Slovak RepublicSloveniaSolomon IslandsSouth AfricaSouth SudanSpainSri LankaSt. Kitts and NevisSt. LuciaSt. Vincent and the GrenadinesSudanSurinameSwazilandSwedenSwitzerlandSyrian Arab RepublicTajikistanTanzaniaThailandTimor-LesteTogoTongaTrinidad and TobagoTunisiaTurkeyTuvaluUgandaUkraineUnited KingdomUnited StatesUruguayVanuatuVenezuela, RBVietnamWest Bank and GazaYemen, Rep.ZambiaZimbabwe
La ligne de temps
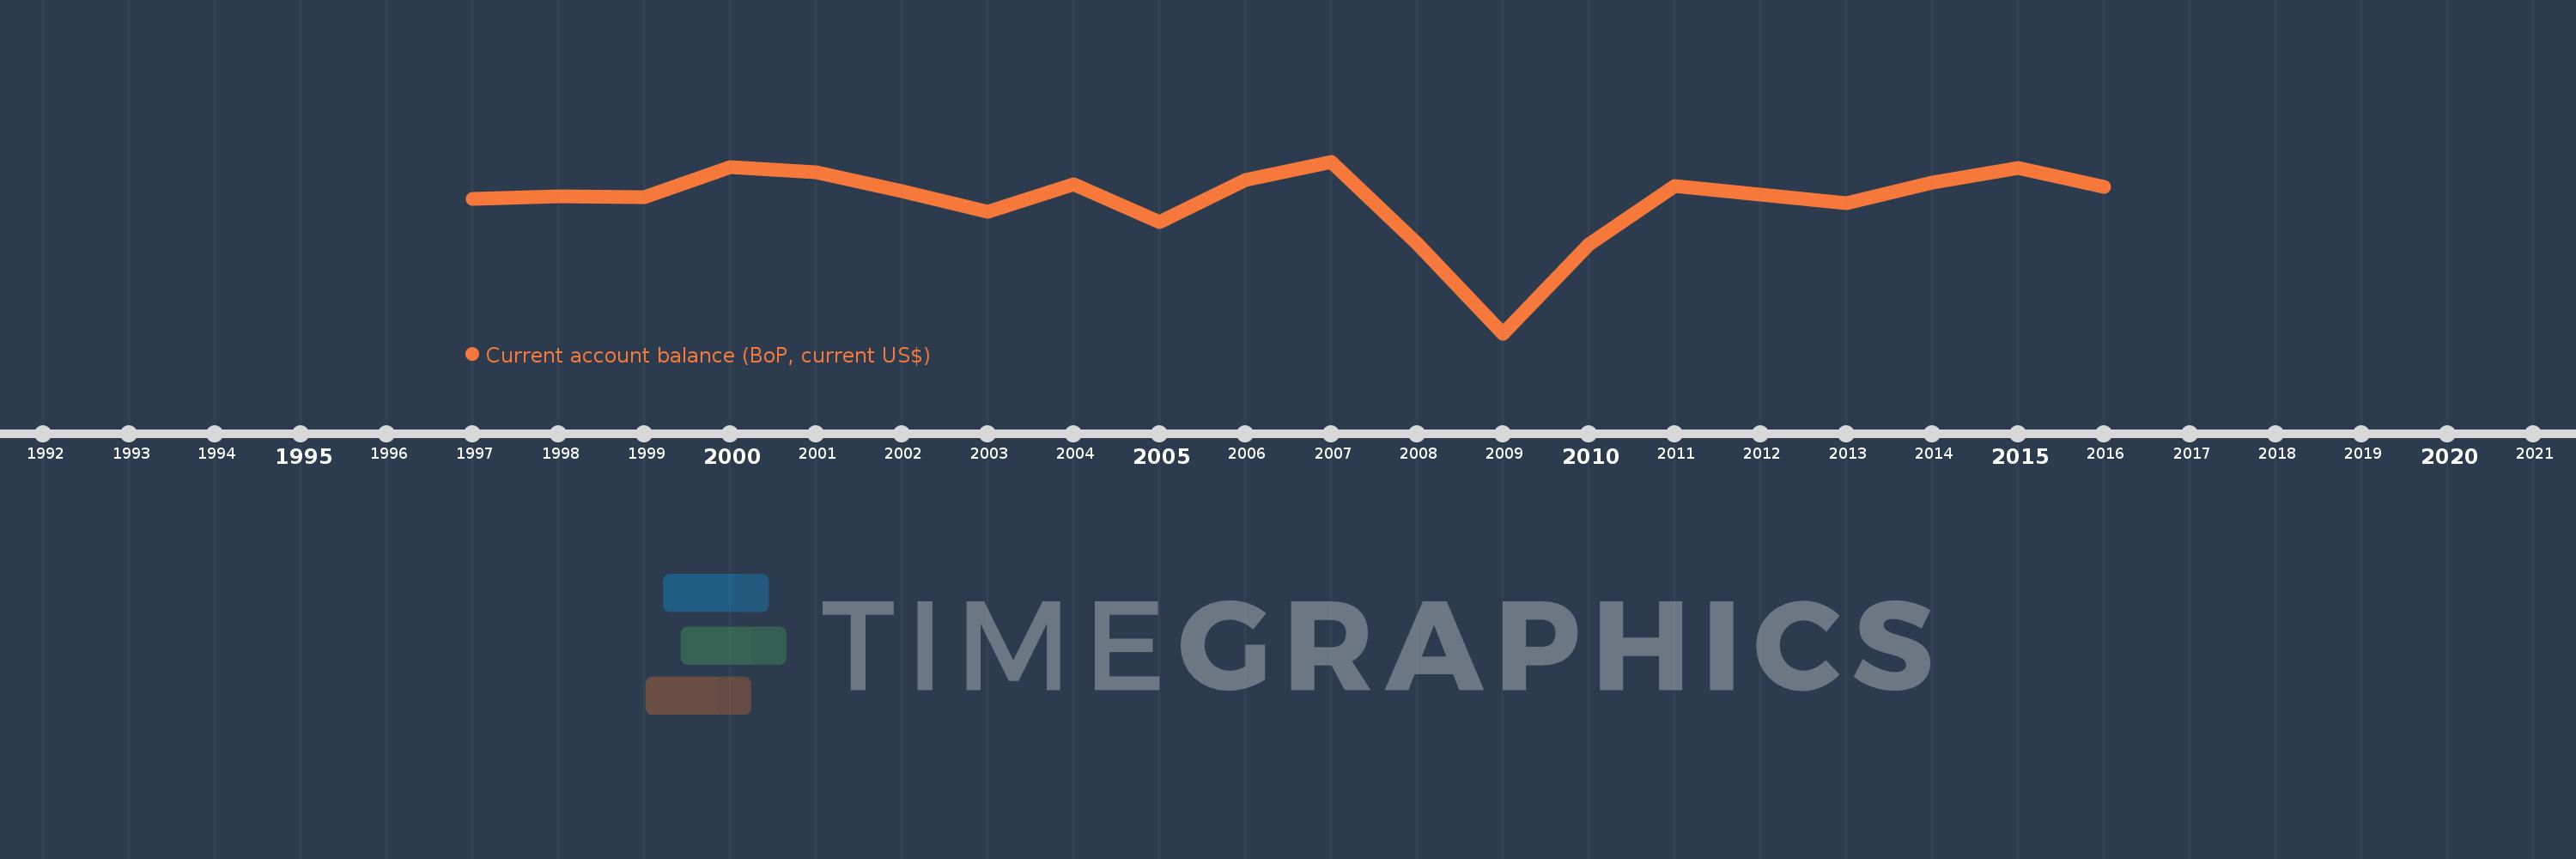
Cette échelle de temps montre un graphique de 1997 année à 2016 année Macedonia, FYR. Les données jusqu'à 1996 année ne sont pas présentés. Quantité d'observations actuelles selon dates: 20.
Source (désignation):
Les indicateurs du développement mondiale
Source (organisation):
International Monetary Fund, Balance of Payments Statistics Yearbook and data files.
Catégories:
Economy & Growth, External Debt
Dernière mise à jour
23 avr. 2017
Les indicateurs de changement de valeurs selon les années
En moyenne:
-306.704 mln.
Minimum:
-1.236 mds
1 janv. 2009
Maximum:
-28.548 mln.
1 janv. 2007
Pour la date d''observation
Valeur
Changement absolu
Le changement par rapport à la valeur précédente
1 janv. 1997
-288.14 mln.
-288.14 mln.
0.0%
1 janv. 1998
-275.49 mln.
+12.65 mln.
-4.39%
1 janv. 1999
-280.1 mln.
-4.61 mln.
1.67%
1 janv. 2000
-65.564 mln.
+214.536 mln.
-76.59%
1 janv. 2001
-103.115 mln.
-37.551 mln.
57.27%
1 janv. 2002
-235.352 mln.
-132.237 mln.
128.24%
1 janv. 2003
-378.757 mln.
-143.405 mln.
60.93%
1 janv. 2004
-185.504 mln.
+193.253 mln.
-51.02%
1 janv. 2005
-451.606 mln.
-266.102 mln.
143.45%
1 janv. 2006
-159.302 mln.
+292.304 mln.
-64.73%
1 janv. 2007
-28.548 mln.
+130.754 mln.
-82.08%
1 janv. 2008
-605.748 mln.
-577.199 mln.
2.02 milles%
1 janv. 2009
-1.236 mds
-630.048 mln.
104.01%
1 janv. 2010
-609.565 mln.
+626.23 mln.
-50.67%
1 janv. 2011
-198.295 mln.
+411.271 mln.
-67.47%
1 janv. 2012
-261.702 mln.
-63.407 mln.
31.98%
1 janv. 2013
-319.136 mln.
-57.434 mln.
21.95%
1 janv. 2014
-177.155 mln.
+141.981 mln.
-44.49%
1 janv. 2015
-71.568 mln.
+105.587 mln.
-59.6%
1 janv. 2016
-203.643 mln.
-132.075 mln.
184.54%
Classement des pays selon les statistiques actuelles par années

Commentaires:

Envoyer
PremiumAbout & FeedbackUn accordConfidentialité
logo
© 2022 Selected Technologies LLC – Morgan Hill, California