29
/fr/
fr
AIzaSyAYiBZKx7MnpbEhh9jyipgxe19OcubqV5w
April 1, 2024
137830
Georgia
GEO
true
2
1
Current account balance (BoP, current US$)
2016,2015,2014,2013,2012,2011,2010,2009,2008,2007,2006,2005,2004,2003,2002,2001,2000,1999,1998
Download
Bibliothèque de statistiques globales →Georgia →

Current account balance (BoP, current US$)

Cette statistique dans les autres pays:
AfghanistanAlbaniaAlgeriaAngolaAntigua and BarbudaArgentinaArmeniaArubaAustraliaAustriaAzerbaijanBahamas, TheBahrainBangladeshBarbadosBelarusBelgiumBelizeBeninBermudaBhutanBoliviaBosnia and HerzegovinaBotswanaBrazilBrunei DarussalamBulgariaBurkina FasoBurundiCabo VerdeCambodiaCameroonCanadaCentral African RepublicChadChileChinaColombiaComorosCongo, Dem. Rep.Congo, Rep.Costa RicaCote d'IvoireCroatiaCuracaoCyprusCzech RepublicDenmarkDjiboutiDominicaDominican RepublicEcuadorEgypt, Arab Rep.El SalvadorEquatorial GuineaEritreaEstoniaEthiopiaEuro areaFaroe IslandsFijiFinlandFranceFrench PolynesiaGabonGambia, TheGeorgiaGermanyGhanaGreeceGrenadaGuatemalaGuineaGuinea-BissauGuyanaHaitiHondurasHong Kong SAR, ChinaHungaryIcelandIndiaIndonesiaIran, Islamic Rep.IraqIrelandIsraelItalyJamaicaJapanJordanKazakhstanKenyaKiribatiKorea, Rep.KosovoKuwaitKyrgyz RepublicLao PDRLatviaLebanonLesothoLiberiaLibyaLithuaniaLuxembourgMacao SAR, ChinaMacedonia, FYRMadagascarMalawiMalaysiaMaldivesMaliMaltaMarshall IslandsMauritaniaMauritiusMexicoMicronesia, Fed. Sts.MoldovaMongoliaMontenegroMoroccoMozambiqueMyanmarNamibiaNepalNetherlandsNew CaledoniaNew ZealandNicaraguaNigerNigeriaNorwayOmanPakistanPalauPanamaPapua New GuineaParaguayPeruPhilippinesPolandPortugalQatarRomaniaRussian FederationRwandaSamoaSao Tome and PrincipeSaudi ArabiaSenegalSerbiaSeychellesSierra LeoneSingaporeSint Maarten (Dutch part)Slovak RepublicSloveniaSolomon IslandsSouth AfricaSouth SudanSpainSri LankaSt. Kitts and NevisSt. LuciaSt. Vincent and the GrenadinesSudanSurinameSwazilandSwedenSwitzerlandSyrian Arab RepublicTajikistanTanzaniaThailandTimor-LesteTogoTongaTrinidad and TobagoTunisiaTurkeyTuvaluUgandaUkraineUnited KingdomUnited StatesUruguayVanuatuVenezuela, RBVietnamWest Bank and GazaYemen, Rep.ZambiaZimbabwe
La ligne de temps
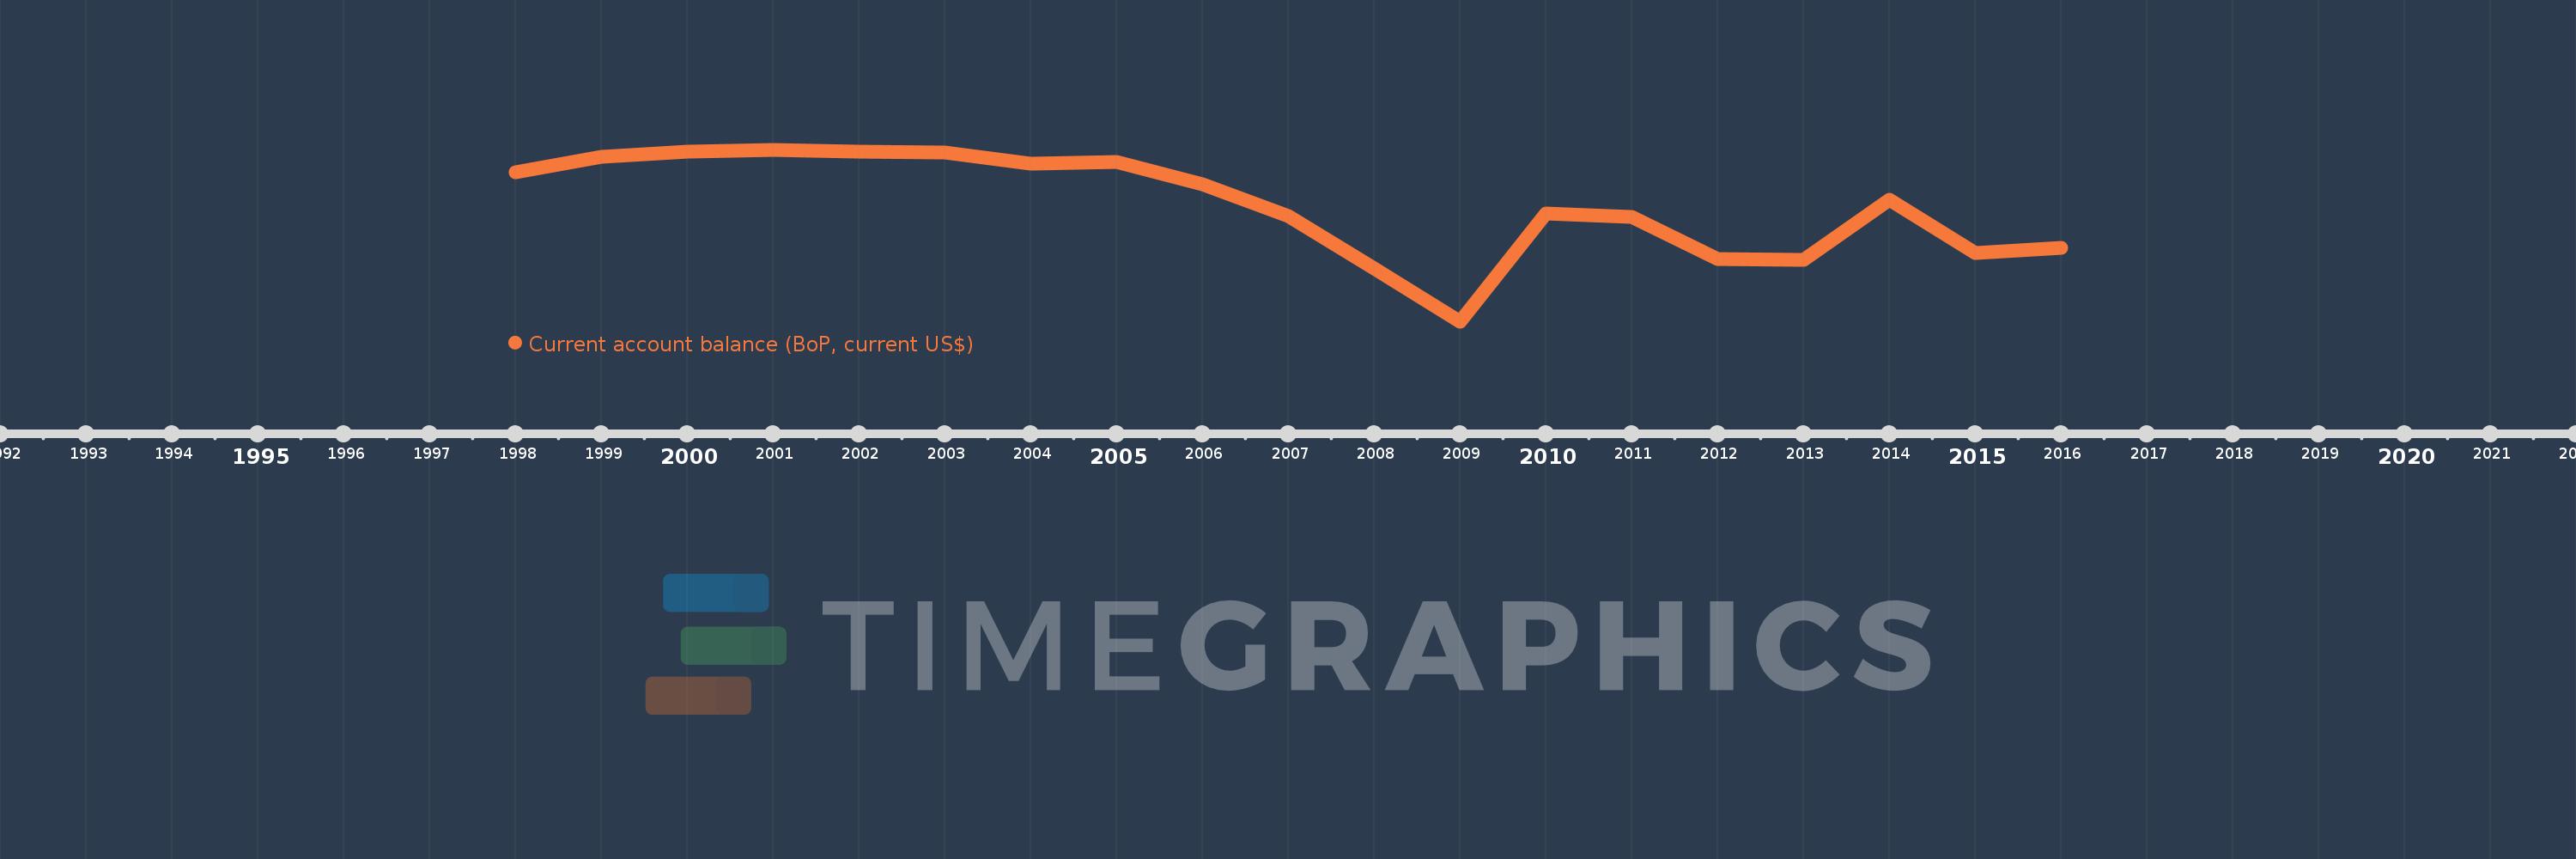
Cette échelle de temps montre un graphique de 1998 année à 2016 année Georgia. Les données jusqu'à 1997 année ne sont pas présentés. Quantité d'observations actuelles selon dates: 19.
Source (désignation):
Les indicateurs du développement mondiale
Source (organisation):
International Monetary Fund, Balance of Payments Statistics Yearbook and data files.
Catégories:
Economy & Growth, External Debt
Dernière mise à jour
23 avr. 2017
Les indicateurs de changement de valeurs selon les années
En moyenne:
-1.021 mds
Minimum:
-2.81 mds
1 janv. 2009
Maximum:
-175.993 mln.
1 janv. 2001
Pour la date d''observation
Valeur
Changement absolu
Le changement par rapport à la valeur précédente
1 janv. 1998
-514.2 mln.
-514.2 mln.
0.0%
1 janv. 1999
-275.7 mln.
+238.5 mln.
-46.38%
1 janv. 2000
-198.4 mln.
+77.3 mln.
-28.04%
1 janv. 2001
-175.993 mln.
+22.407 mln.
-11.29%
1 janv. 2002
-197.188 mln.
-21.195 mln.
12.04%
1 janv. 2003
-217.006 mln.
-19.818 mln.
10.05%
1 janv. 2004
-382.38 mln.
-165.374 mln.
76.21%
1 janv. 2005
-356.023 mln.
+26.357 mln.
-6.89%
1 janv. 2006
-694.805 mln.
-338.783 mln.
95.16%
1 janv. 2007
-1.19 mds
-495.556 mln.
71.32%
1 janv. 2008
-1.991 mds
-800.793 mln.
67.27%
1 janv. 2009
-2.81 mds
-819.161 mln.
41.14%
1 janv. 2010
-1.14 mds
+1.67 mds
-59.43%
1 janv. 2011
-1.198 mds
-57.676 mln.
5.06%
1 janv. 2012
-1.842 mds
-644.292 mln.
53.78%
1 janv. 2013
-1.853 mds
-10.741 mln.
0.58%
1 janv. 2014
-934.659 mln.
+918.311 mln.
-49.56%
1 janv. 2015
-1.751 mds
-815.986 mln.
87.3%
1 janv. 2016
-1.673 mds
+78.123 mln.
-4.46%
Classement des pays selon les statistiques actuelles par années

Commentaires:

Envoyer
PremiumAbout & FeedbackUn accordConfidentialité
logo
© 2022 Selected Technologies LLC – Morgan Hill, California