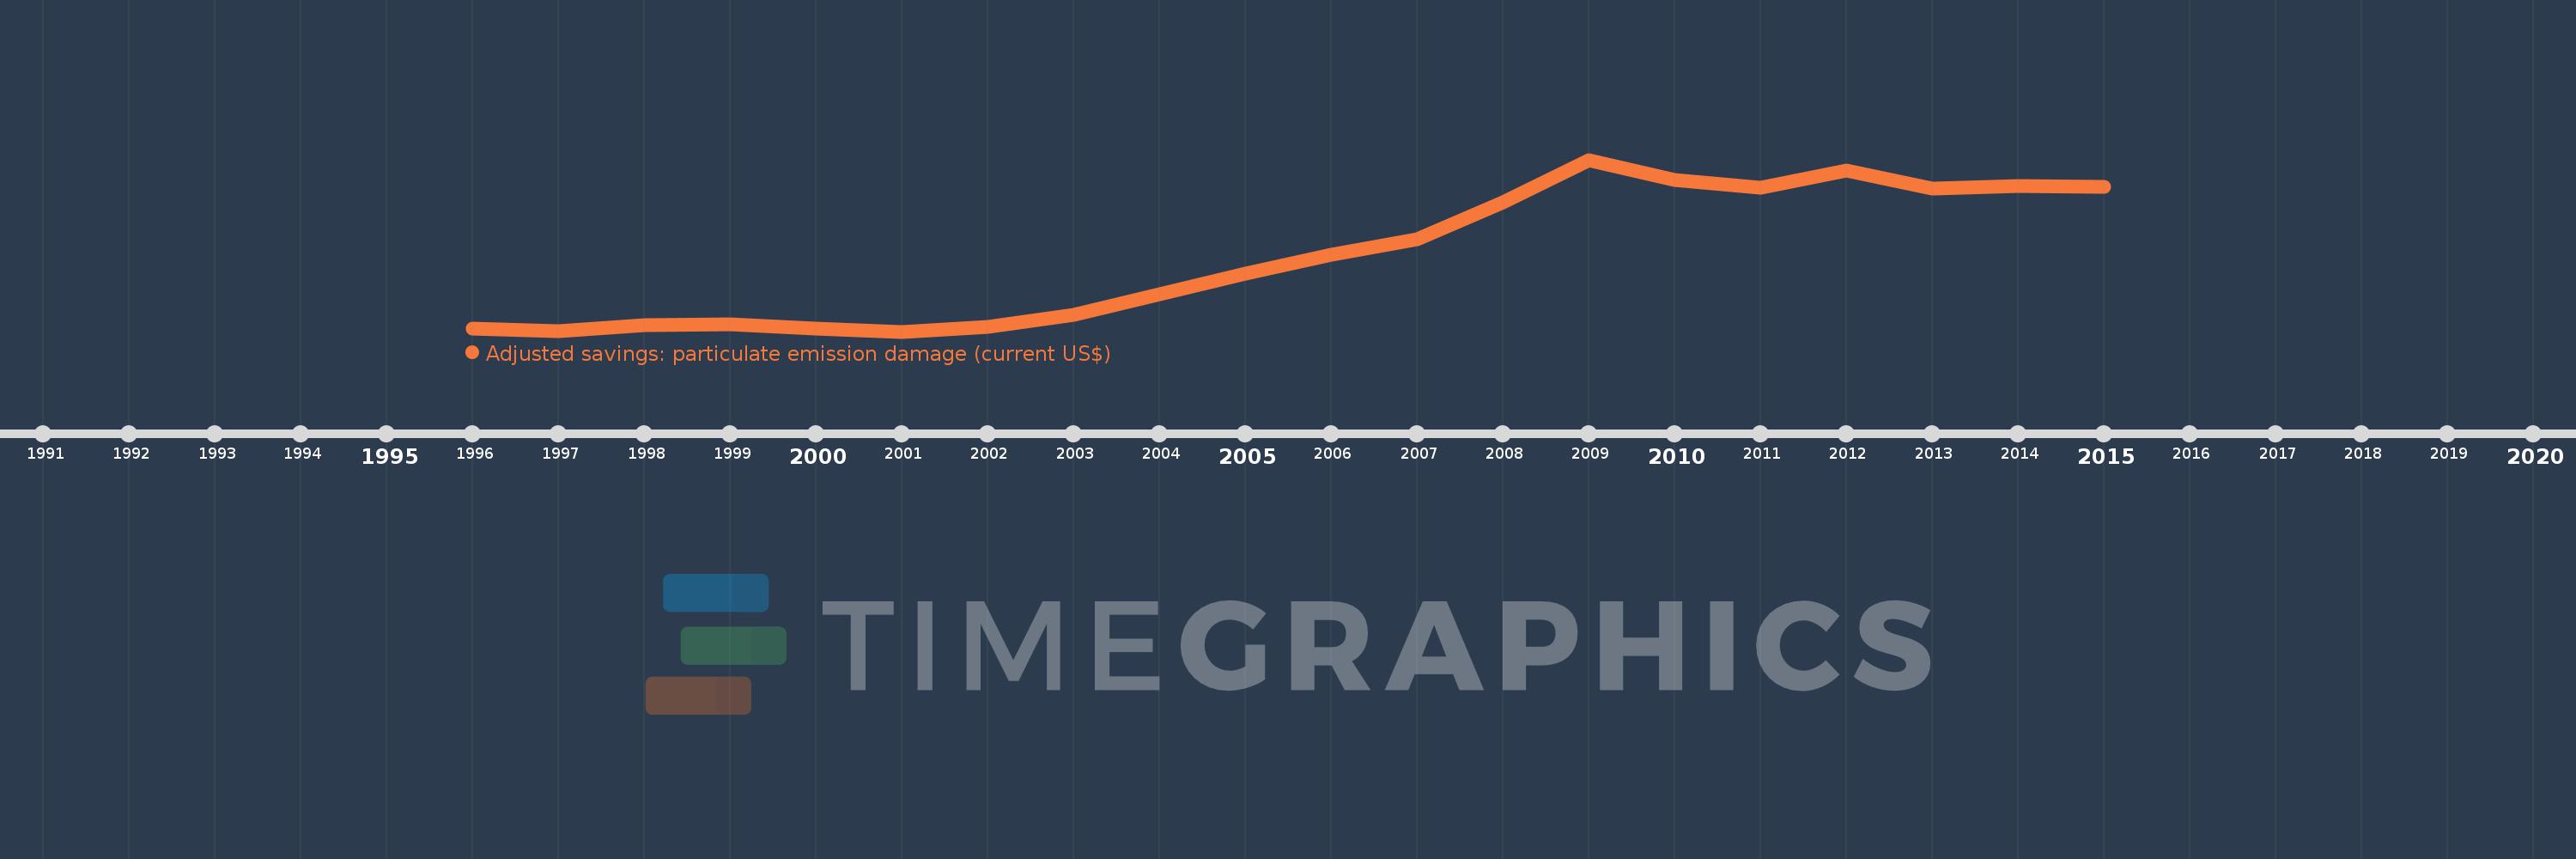
Cette échelle de temps montre un graphique de 1996 année à 2015 année Lithuania. Les données jusqu'à 1995 année ne sont pas présentés. Quantité d'observations actuelles selon dates: 20.
Source (désignation):
Les indicateurs du développement mondiale
Source (organisation):
Data on health impacts from exposure to ambient PM2.5 pollution and household air pollution are from the Global Burden of Disease 2010 study. Data are provided by the Institute for Health Metrics and Evaluation at the University of Washington.
Catégories:
Economy & Growth, Environment
Dernière mise à jour
23 avr. 2017
Les indicateurs de changement de valeurs selon les années
En moyenne:
90.088 mln.
Minimum:
43.742 mln.
1 janv. 2001
Maximum:
150.031 mln.
1 janv. 2009
Pour la date d''observation
Valeur
Changement absolu
Le changement par rapport à la valeur précédente
1 janv. 1996
45.565 mln.
+45.565 mln.
0.0%
1 janv. 1997
44.095 mln.
-1.47 mln.
-3.23%
1 janv. 1998
47.821 mln.
+3.726 mln.
8.45%
1 janv. 1999
48.516 mln.
+695.133 milles
1.45%
1 janv. 2000
45.468 mln.
-3.048 mln.
-6.28%
1 janv. 2001
43.742 mln.
-1.726 mln.
-3.8%
1 janv. 2002
46.759 mln.
+3.017 mln.
6.9%
1 janv. 2003
53.903 mln.
+7.144 mln.
15.28%
1 janv. 2004
66.887 mln.
+12.983 mln.
24.09%
1 janv. 2005
79.687 mln.
+12.8 mln.
19.14%
1 janv. 2006
91.568 mln.
+11.881 mln.
14.91%
1 janv. 2007
100.896 mln.
+9.328 mln.
10.19%
1 janv. 2008
123.731 mln.
+22.835 mln.
22.63%
1 janv. 2009
150.031 mln.
+26.3 mln.
21.26%
1 janv. 2010
137.371 mln.
-12.66 mln.
-8.44%
1 janv. 2011
132.494 mln.
-4.877 mln.
-3.55%
1 janv. 2012
143.487 mln.
+10.993 mln.
8.3%
1 janv. 2013
132.351 mln.
-11.135 mln.
-7.76%
1 janv. 2014
133.875 mln.
+1.524 mln.
1.15%
1 janv. 2015
133.515 mln.
-360.269 milles
-0.27%
Classement des pays selon les statistiques actuelles par années