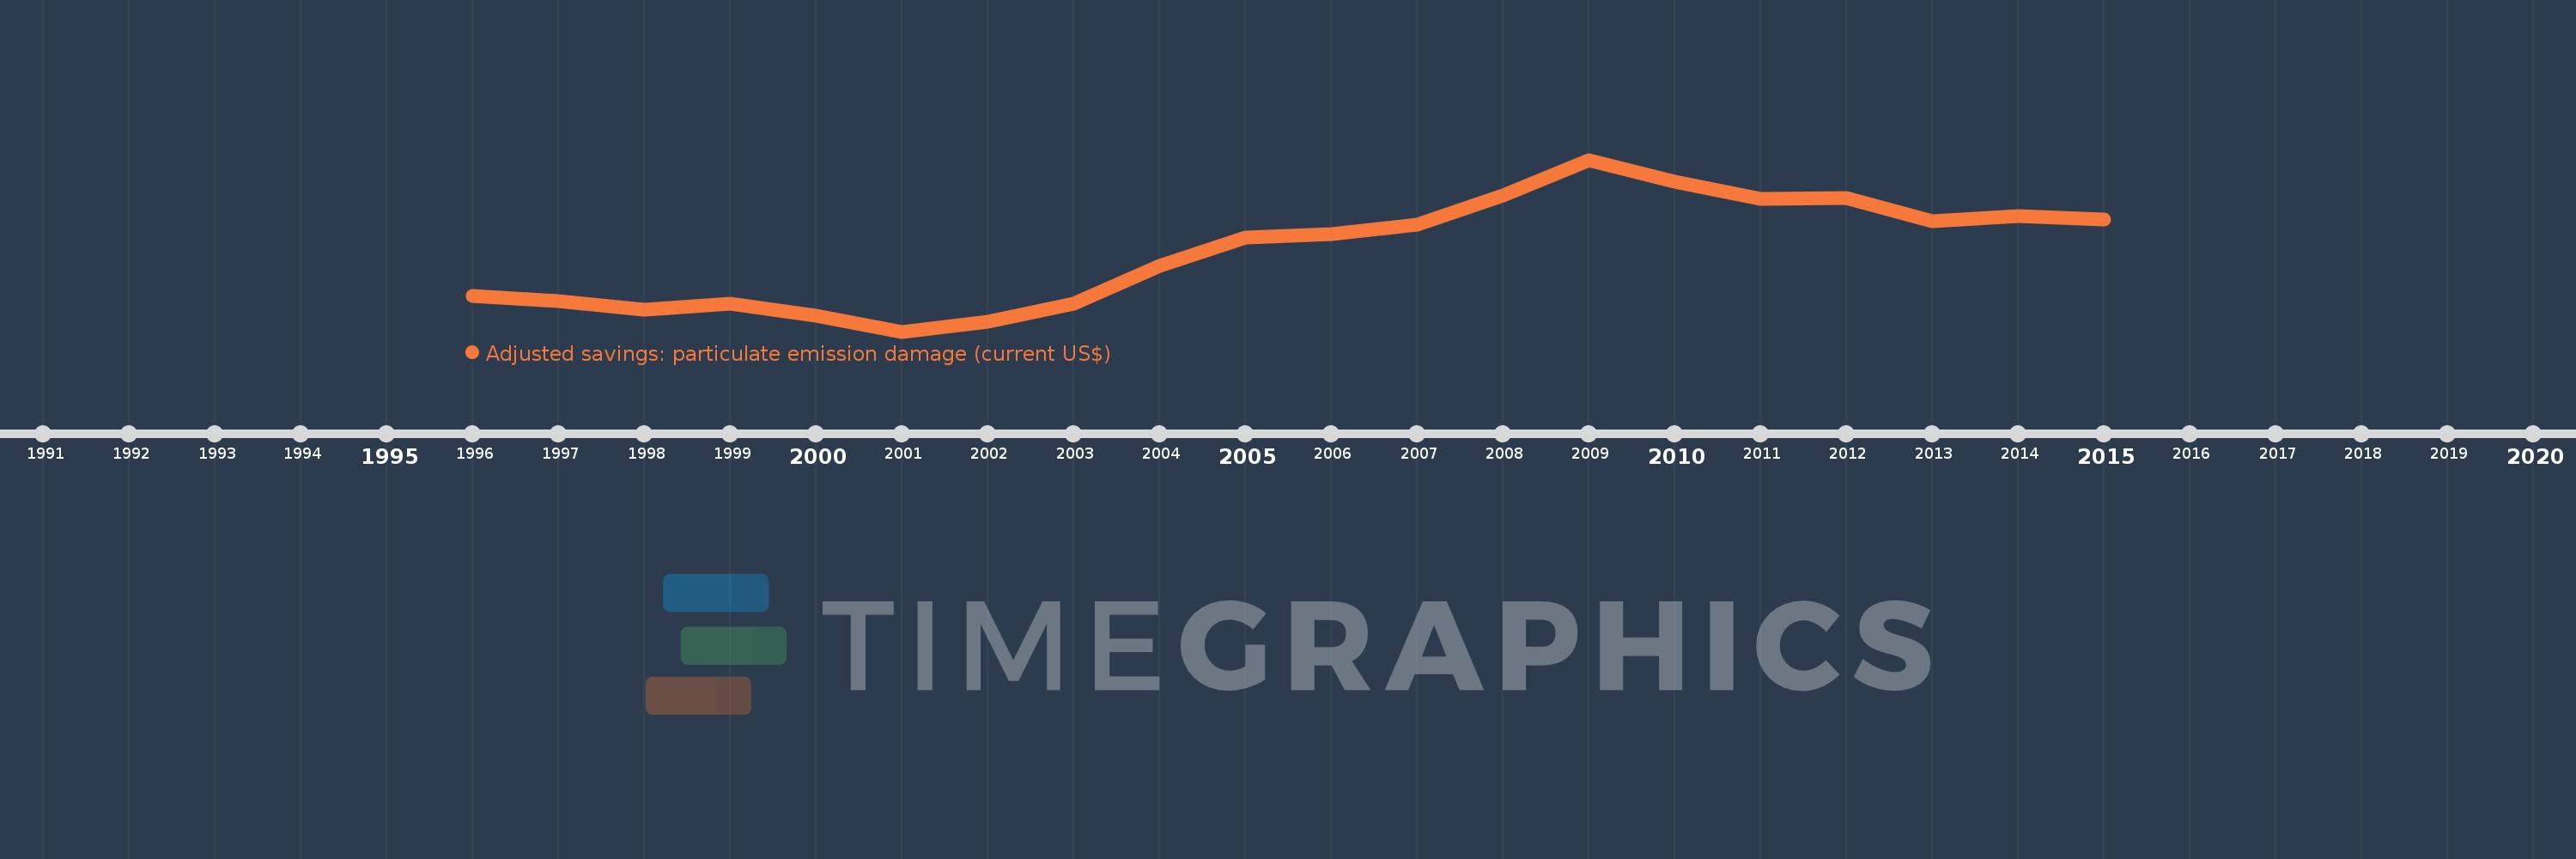
Cette échelle de temps montre un graphique de 1996 année à 2015 année Croatia. Les données jusqu'à 1995 année ne sont pas présentés. Quantité d'observations actuelles selon dates: 20.
Source (désignation):
Les indicateurs du développement mondiale
Source (organisation):
Data on health impacts from exposure to ambient PM2.5 pollution and household air pollution are from the Global Burden of Disease 2010 study. Data are provided by the Institute for Health Metrics and Evaluation at the University of Washington.
Catégories:
Economy & Growth, Environment
Dernière mise à jour
23 avr. 2017
Les indicateurs de changement de valeurs selon les années
En moyenne:
176.421 mln.
Minimum:
115.062 mln.
1 janv. 2001
Maximum:
247.102 mln.
1 janv. 2009
Pour la date d''observation
Valeur
Changement absolu
Le changement par rapport à la valeur précédente
1 janv. 1996
142.192 mln.
+142.192 mln.
0.0%
1 janv. 1997
138.479 mln.
-3.713 mln.
-2.61%
1 janv. 1998
132.224 mln.
-6.255 mln.
-4.52%
1 janv. 1999
136.301 mln.
+4.077 mln.
3.08%
1 janv. 2000
127.221 mln.
-9.08 mln.
-6.66%
1 janv. 2001
115.062 mln.
-12.16 mln.
-9.56%
1 janv. 2002
122.942 mln.
+7.88 mln.
6.85%
1 janv. 2003
136.222 mln.
+13.28 mln.
10.8%
1 janv. 2004
165.703 mln.
+29.48 mln.
21.64%
1 janv. 2005
187.654 mln.
+21.952 mln.
13.25%
1 janv. 2006
190.066 mln.
+2.412 mln.
1.29%
1 janv. 2007
197.416 mln.
+7.35 mln.
3.87%
1 janv. 2008
219.424 mln.
+22.007 mln.
11.15%
1 janv. 2009
247.102 mln.
+27.678 mln.
12.61%
1 janv. 2010
230.143 mln.
-16.958 mln.
-6.86%
1 janv. 2011
216.972 mln.
-13.172 mln.
-5.72%
1 janv. 2012
217.985 mln.
+1.014 mln.
0.47%
1 janv. 2013
199.845 mln.
-18.14 mln.
-8.32%
1 janv. 2014
204.145 mln.
+4.301 mln.
2.15%
1 janv. 2015
201.314 mln.
-2.831 mln.
-1.39%
Classement des pays selon les statistiques actuelles par années