29
/fr/
fr
AIzaSyAYiBZKx7MnpbEhh9jyipgxe19OcubqV5w
April 1, 2024
177623
Lesotho
LSO
true
2
1
External balance on goods and services (current LCU)
1982,1981,1980,1979,1978,1977,1976,1975,1974,1973,1972,1971,1970,1969,1968,1967,1966,1965,1964,1963,1962,1961
Download
Bibliothèque de statistiques globales →Lesotho →

External balance on goods and services (current LCU)

Cette statistique dans les autres pays:
AfghanistanAlbaniaAlgeriaAngolaAntigua and BarbudaArgentinaArmeniaArubaAustraliaAustriaAzerbaijanBahamas, TheBahrainBangladeshBarbadosBelarusBelgiumBelizeBeninBermudaBhutanBoliviaBosnia and HerzegovinaBotswanaBrazilBrunei DarussalamBulgariaBurkina FasoBurundiCabo VerdeCambodiaCameroonCanadaCentral African RepublicChadChileChinaColombiaComorosCongo, Dem. Rep.Congo, Rep.Costa RicaCote d'IvoireCroatiaCubaCyprusCzech RepublicDenmarkDjiboutiDominicaDominican RepublicEcuadorEgypt, Arab Rep.El SalvadorEquatorial GuineaEritreaEstoniaEthiopiaFaroe IslandsFijiFinlandFranceFrench PolynesiaGabonGambia, TheGeorgiaGermanyGhanaGreeceGrenadaGuatemalaGuineaGuinea-BissauGuyanaHaitiHondurasHong Kong SAR, ChinaHungaryIcelandIndiaIndonesiaIran, Islamic Rep.IraqIrelandIsraelItalyJamaicaJapanJordanKazakhstanKenyaKiribatiKorea, Rep.KosovoKuwaitKyrgyz RepublicLao PDRLatviaLebanonLesothoLiberiaLibyaLithuaniaLuxembourgMacao SAR, ChinaMacedonia, FYRMadagascarMalawiMalaysiaMaldivesMaliMaltaMauritaniaMauritiusMexicoMicronesia, Fed. Sts.MoldovaMongoliaMontenegroMoroccoMozambiqueMyanmarNamibiaNepalNetherlandsNew CaledoniaNew ZealandNicaraguaNigerNigeriaNorwayOmanPakistanPalauPanamaPapua New GuineaParaguayPeruPhilippinesPolandPortugalPuerto RicoQatarRomaniaRussian FederationRwandaSamoaSaudi ArabiaSenegalSerbiaSeychellesSierra LeoneSingaporeSlovak RepublicSloveniaSolomon IslandsSomaliaSouth AfricaSouth SudanSpainSri LankaSt. Kitts and NevisSt. LuciaSt. Vincent and the GrenadinesSudanSurinameSwazilandSwedenSwitzerlandSyrian Arab RepublicTajikistanTanzaniaThailandTimor-LesteTogoTongaTrinidad and TobagoTunisiaTurkeyTurkmenistanUgandaUkraineUnited Arab EmiratesUnited KingdomUnited StatesUruguayUzbekistanVanuatuVenezuela, RBVietnamWest Bank and GazaYemen, Rep.ZambiaZimbabwe
La ligne de temps
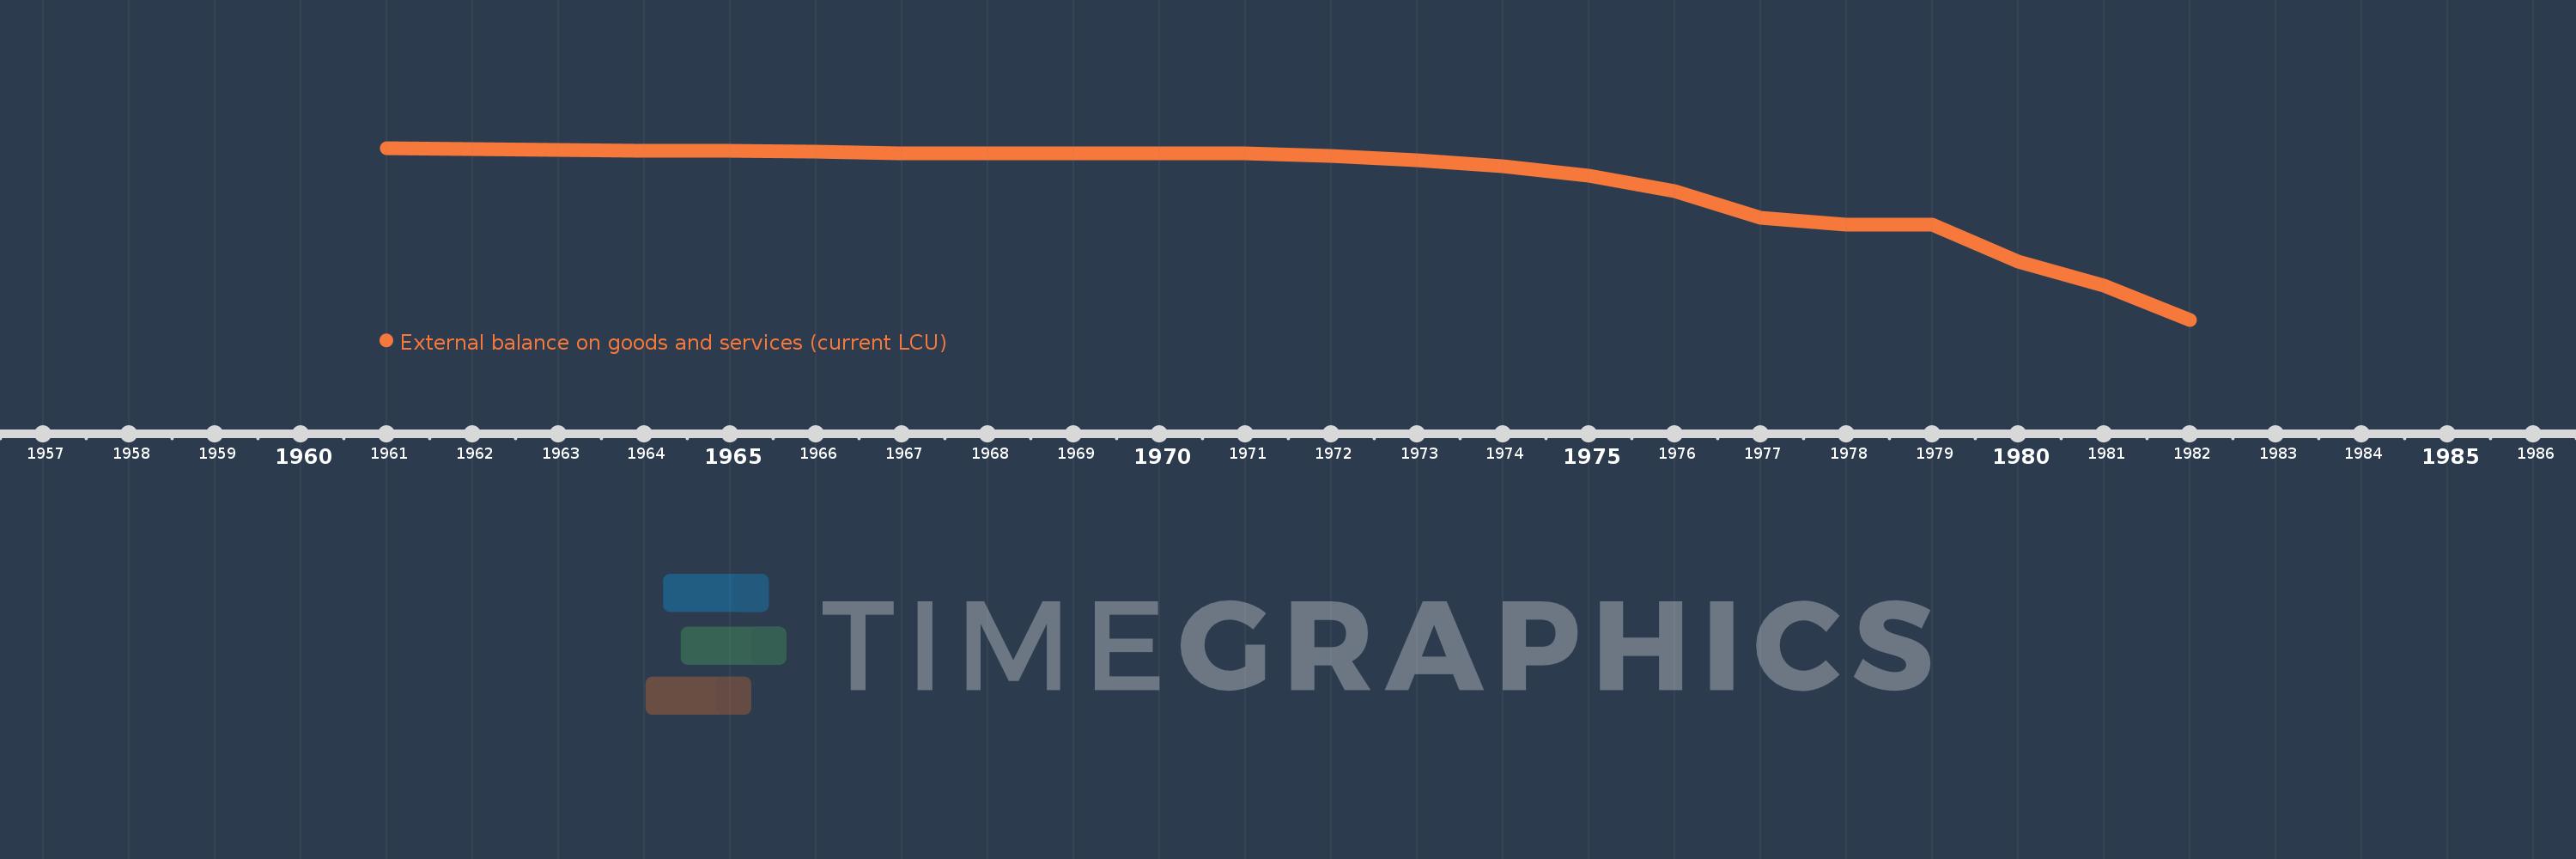
Cette échelle de temps montre un graphique de 1961 année à 1982 année Lesotho. Les données jusqu'à 1960 année ne sont pas présentés. Quantité d'observations actuelles selon dates: 22.
Source (désignation):
Les indicateurs du développement mondiale
Source (organisation):
World Bank national accounts data, and OECD National Accounts data files.
Catégories:
Economy & Growth
Dernière mise à jour
23 avr. 2017
Les indicateurs de changement de valeurs selon les années
En moyenne:
-83.432 mln.
Minimum:
-372.3 mln.
1 janv. 1982
Maximum:
-6.6 mln.
1 janv. 1961
Pour la date d''observation
Valeur
Changement absolu
Le changement par rapport à la valeur précédente
1 janv. 1961
-6.6 mln.
-6.6 mln.
0.0%
1 janv. 1962
-8.4 mln.
-1.8 mln.
27.27%
1 janv. 1963
-10.0 mln.
-1.6 mln.
19.05%
1 janv. 1964
-12.1 mln.
-2.1 mln.
21.0%
1 janv. 1965
-12.7 mln.
-600.0 milles
4.96%
1 janv. 1966
-14.8 mln.
-2.1 mln.
16.54%
1 janv. 1967
-18.5 mln.
-3.7 mln.
25.0%
1 janv. 1968
-18.9 mln.
-400.0 milles
2.16%
1 janv. 1969
-18.9 mln.
0.0
0.0%
1 janv. 1970
-17.9 mln.
+1000.0 milles
-5.29%
1 janv. 1971
-18.0 mln.
-100.0 milles
0.56%
1 janv. 1972
-23.0 mln.
-5.0 mln.
27.78%
1 janv. 1973
-33.0 mln.
-10.0 mln.
43.48%
1 janv. 1974
-45.0 mln.
-12.0 mln.
36.36%
1 janv. 1975
-65.0 mln.
-20.0 mln.
44.44%
1 janv. 1976
-99.0 mln.
-34.0 mln.
52.31%
1 janv. 1977
-155.0 mln.
-56.0 mln.
56.57%
1 janv. 1978
-169.0 mln.
-14.0 mln.
9.03%
1 janv. 1979
-170.0 mln.
-1000.0 milles
0.59%
1 janv. 1980
-248.0 mln.
-78.0 mln.
45.88%
1 janv. 1981
-299.4 mln.
-51.4 mln.
20.73%
1 janv. 1982
-372.3 mln.
-72.9 mln.
24.35%
Classement des pays selon les statistiques actuelles par années

Commentaires:

Envoyer
PremiumAbout & FeedbackUn accordConfidentialité
logo
© 2022 Selected Technologies LLC – Morgan Hill, California