29
/fr/
fr
AIzaSyAYiBZKx7MnpbEhh9jyipgxe19OcubqV5w
April 1, 2024
129292
Estonia
EST
true
2
1
External balance on goods and services (current LCU)
2016,2015,2014,2013,2012,2011,2010,2009,2008,2007,2006,2005,2004,2003,2002,2001,2000,1999,1998,1997,1996,1995,1994
Download
Bibliothèque de statistiques globales →Estonia →

External balance on goods and services (current LCU)

Cette statistique dans les autres pays:
AfghanistanAlbaniaAlgeriaAngolaAntigua and BarbudaArgentinaArmeniaArubaAustraliaAustriaAzerbaijanBahamas, TheBahrainBangladeshBarbadosBelarusBelgiumBelizeBeninBermudaBhutanBoliviaBosnia and HerzegovinaBotswanaBrazilBrunei DarussalamBulgariaBurkina FasoBurundiCabo VerdeCambodiaCameroonCanadaCentral African RepublicChadChileChinaColombiaComorosCongo, Dem. Rep.Congo, Rep.Costa RicaCote d'IvoireCroatiaCubaCyprusCzech RepublicDenmarkDjiboutiDominicaDominican RepublicEcuadorEgypt, Arab Rep.El SalvadorEquatorial GuineaEritreaEstoniaEthiopiaFaroe IslandsFijiFinlandFranceFrench PolynesiaGabonGambia, TheGeorgiaGermanyGhanaGreeceGrenadaGuatemalaGuineaGuinea-BissauGuyanaHaitiHondurasHong Kong SAR, ChinaHungaryIcelandIndiaIndonesiaIran, Islamic Rep.IraqIrelandIsraelItalyJamaicaJapanJordanKazakhstanKenyaKiribatiKorea, Rep.KosovoKuwaitKyrgyz RepublicLao PDRLatviaLebanonLesothoLiberiaLibyaLithuaniaLuxembourgMacao SAR, ChinaMacedonia, FYRMadagascarMalawiMalaysiaMaldivesMaliMaltaMauritaniaMauritiusMexicoMicronesia, Fed. Sts.MoldovaMongoliaMontenegroMoroccoMozambiqueMyanmarNamibiaNepalNetherlandsNew CaledoniaNew ZealandNicaraguaNigerNigeriaNorwayOmanPakistanPalauPanamaPapua New GuineaParaguayPeruPhilippinesPolandPortugalPuerto RicoQatarRomaniaRussian FederationRwandaSamoaSaudi ArabiaSenegalSerbiaSeychellesSierra LeoneSingaporeSlovak RepublicSloveniaSolomon IslandsSomaliaSouth AfricaSouth SudanSpainSri LankaSt. Kitts and NevisSt. LuciaSt. Vincent and the GrenadinesSudanSurinameSwazilandSwedenSwitzerlandSyrian Arab RepublicTajikistanTanzaniaThailandTimor-LesteTogoTongaTrinidad and TobagoTunisiaTurkeyTurkmenistanUgandaUkraineUnited Arab EmiratesUnited KingdomUnited StatesUruguayUzbekistanVanuatuVenezuela, RBVietnamWest Bank and GazaYemen, Rep.ZambiaZimbabwe
La ligne de temps
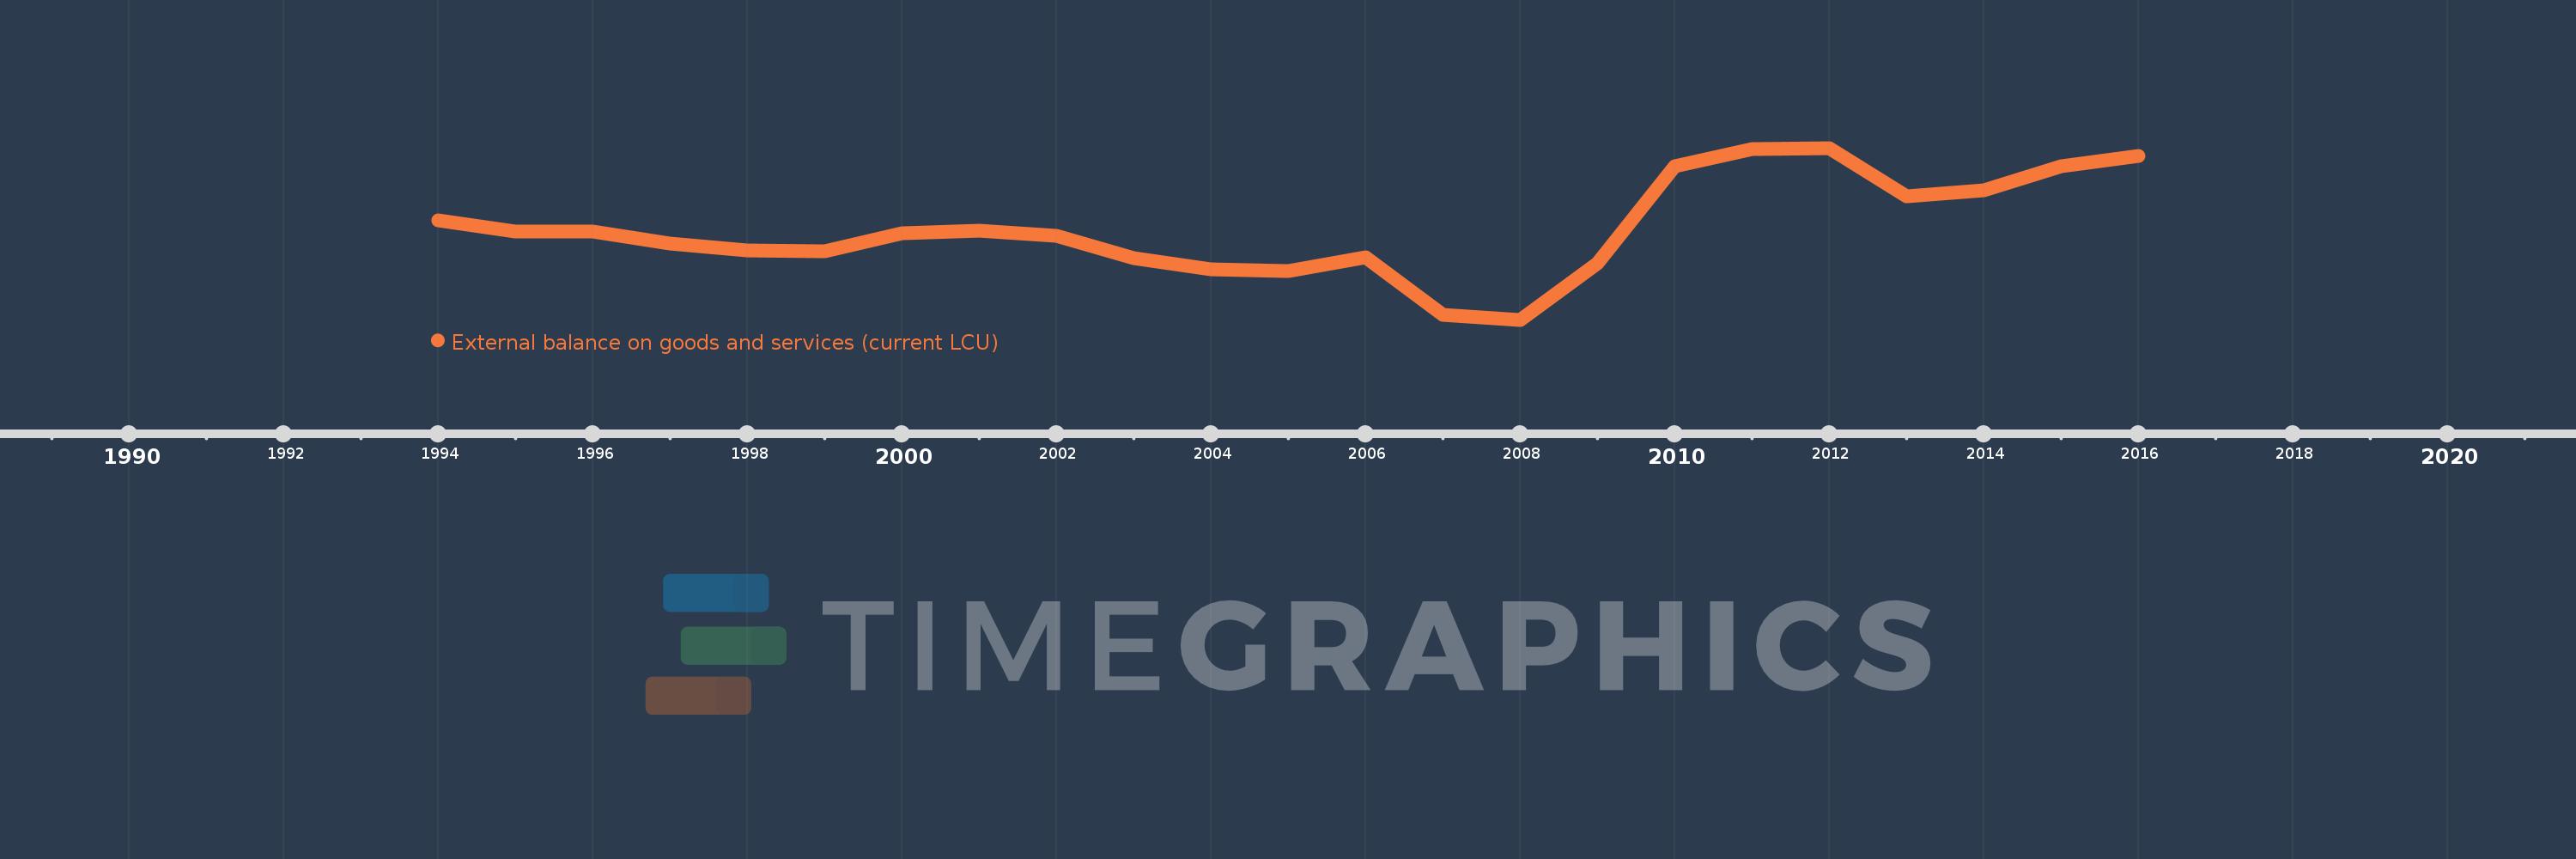
Cette échelle de temps montre un graphique de 1994 année à 2016 année Estonia. Les données jusqu'à 1993 année ne sont pas présentés. Quantité d'observations actuelles selon dates: 23.
Source (désignation):
Les indicateurs du développement mondiale
Source (organisation):
World Bank national accounts data, and OECD National Accounts data files.
Catégories:
Economy & Growth
Dernière mise à jour
23 avr. 2017
Les indicateurs de changement de valeurs selon les années
En moyenne:
-168.69 mln.
Minimum:
-1.442 mds
1 janv. 2008
Maximum:
954.97 mln.
1 janv. 2012
Pour la date d''observation
Valeur
Changement absolu
Le changement par rapport à la valeur précédente
1 janv. 1994
-58.731 mln.
-58.731 mln.
0.0%
1 janv. 1995
-207.258 mln.
-148.528 mln.
252.9%
1 janv. 1996
-208.46 mln.
-1.202 mln.
0.58%
1 janv. 1997
-383.41 mln.
-174.95 mln.
83.92%
1 janv. 1998
-470.4 mln.
-86.99 mln.
22.69%
1 janv. 1999
-488.09 mln.
-17.69 mln.
3.76%
1 janv. 2000
-237.05 mln.
+251.04 mln.
-51.43%
1 janv. 2001
-200.02 mln.
+37.03 mln.
-15.62%
1 janv. 2002
-276.2 mln.
-76.18 mln.
38.09%
1 janv. 2003
-579.37 mln.
-303.17 mln.
109.76%
1 janv. 2004
-739.11 mln.
-159.74 mln.
27.57%
1 janv. 2005
-764.6 mln.
-25.49 mln.
3.45%
1 janv. 2006
-574.92 mln.
+189.68 mln.
-24.81%
1 janv. 2007
-1.372 mds
-796.77 mln.
138.59%
1 janv. 2008
-1.442 mds
-70.07 mln.
5.11%
1 janv. 2009
-648.71 mln.
+793.05 mln.
-55.01%
1 janv. 2010
701.6 mln.
+1.35 mds
-208.15%
1 janv. 2011
935.43 mln.
+233.83 mln.
33.33%
1 janv. 2012
954.97 mln.
+19.54 mln.
2.09%
1 janv. 2013
278.08 mln.
-676.89 mln.
-70.88%
1 janv. 2014
364.27 mln.
+86.19 mln.
30.99%
1 janv. 2015
695.43 mln.
+331.16 mln.
90.91%
1 janv. 2016
840.13 mln.
+144.7 mln.
20.81%
Classement des pays selon les statistiques actuelles par années

Commentaires:

Envoyer
PremiumAbout & FeedbackUn accordConfidentialité
logo
© 2022 Selected Technologies LLC – Morgan Hill, California