29
/fr/
fr
AIzaSyAYiBZKx7MnpbEhh9jyipgxe19OcubqV5w
April 1, 2024
173537
Kyrgyz Republic
KGZ
true
2
1
Service imports (BoP, current US$)
2016,2015,2014,2013,2012,2011,2010,2009,2008,2007,2006,2005,2004,2003,2002,2001,2000,1999,1998,1997,1996,1995,1994
Download
Bibliothèque de statistiques globales →Kyrgyz Republic →

Service imports (BoP, current US$)

Cette statistique dans les autres pays:
AfghanistanAlbaniaAlgeriaAngolaAntigua and BarbudaArab WorldArgentinaArmeniaArubaAustraliaAustriaAzerbaijanBahamas, TheBahrainBangladeshBarbadosBelarusBelgiumBelizeBeninBermudaBhutanBoliviaBosnia and HerzegovinaBotswanaBrazilBrunei DarussalamBulgariaBurkina FasoBurundiCabo VerdeCambodiaCameroonCanadaCaribbean small statesCentral African RepublicCentral Europe and the BalticsChadChileChinaColombiaComorosCongo, Dem. Rep.Congo, Rep.Costa RicaCote d'IvoireCroatiaCuracaoCyprusCzech RepublicDenmarkDjiboutiDominicaDominican RepublicEarly-demographic dividendEast Asia & PacificEast Asia & Pacific (excluding high income)East Asia & Pacific (IDA & IBRD countries)EcuadorEgypt, Arab Rep.El SalvadorEquatorial GuineaEritreaEstoniaEthiopiaEuro areaEurope & Central AsiaEurope & Central Asia (excluding high income)Europe & Central Asia (IDA & IBRD countries)European UnionFaroe IslandsFijiFinlandFragile and conflict affected situationsFranceFrench PolynesiaGabonGambia, TheGeorgiaGermanyGhanaGreeceGrenadaGuatemalaGuineaGuinea-BissauGuyanaHaitiHeavily indebted poor countries (HIPC)High incomeHondurasHong Kong SAR, ChinaHungaryIBRD onlyIcelandIDA & IBRD totalIDA blendIDA onlyIDA totalIndiaIndonesiaIran, Islamic Rep.IraqIrelandIsraelItalyJamaicaJapanJordanKazakhstanKenyaKiribatiKorea, Rep.KosovoKuwaitKyrgyz RepublicLao PDRLate-demographic dividendLatin America & Caribbean Latin America & Caribbean (excluding high income)Latin America & the Caribbean (IDA & IBRD countries)LatviaLeast developed countries: UN classificationLebanonLesothoLiberiaLibyaLithuaniaLow & middle incomeLow incomeLower middle incomeLuxembourgMacao SAR, ChinaMacedonia, FYRMadagascarMalawiMalaysiaMaldivesMaliMaltaMarshall IslandsMauritaniaMauritiusMexicoMicronesia, Fed. Sts.Middle East & North Africa (excluding high income)Middle East & North Africa (IDA & IBRD countries)Middle incomeMoldovaMongoliaMontenegroMoroccoMozambiqueMyanmarNamibiaNepalNetherlandsNew CaledoniaNew ZealandNicaraguaNigerNigeriaNorth AmericaNorwayOECD membersOmanOther small statesPacific island small statesPakistanPalauPanamaPapua New GuineaParaguayPeruPhilippinesPolandPortugalPost-demographic dividendPre-demographic dividendQatarRomaniaRussian FederationRwandaSamoaSao Tome and PrincipeSaudi ArabiaSenegalSerbiaSeychellesSierra LeoneSingaporeSint Maarten (Dutch part)Slovak RepublicSloveniaSmall statesSolomon IslandsSouth AfricaSouth AsiaSouth Asia (IDA & IBRD)South SudanSpainSri LankaSt. Kitts and NevisSt. LuciaSt. Vincent and the GrenadinesSub-Saharan Africa Sub-Saharan Africa (excluding high income)Sub-Saharan Africa (IDA & IBRD countries)SudanSurinameSwazilandSwedenSwitzerlandSyrian Arab RepublicTajikistanTanzaniaThailandTimor-LesteTogoTongaTrinidad and TobagoTunisiaTurkeyTuvaluUgandaUkraineUnited KingdomUnited StatesUpper middle incomeUruguayVanuatuVenezuela, RBVietnamWest Bank and GazaWorldYemen, Rep.ZambiaZimbabwe
La ligne de temps
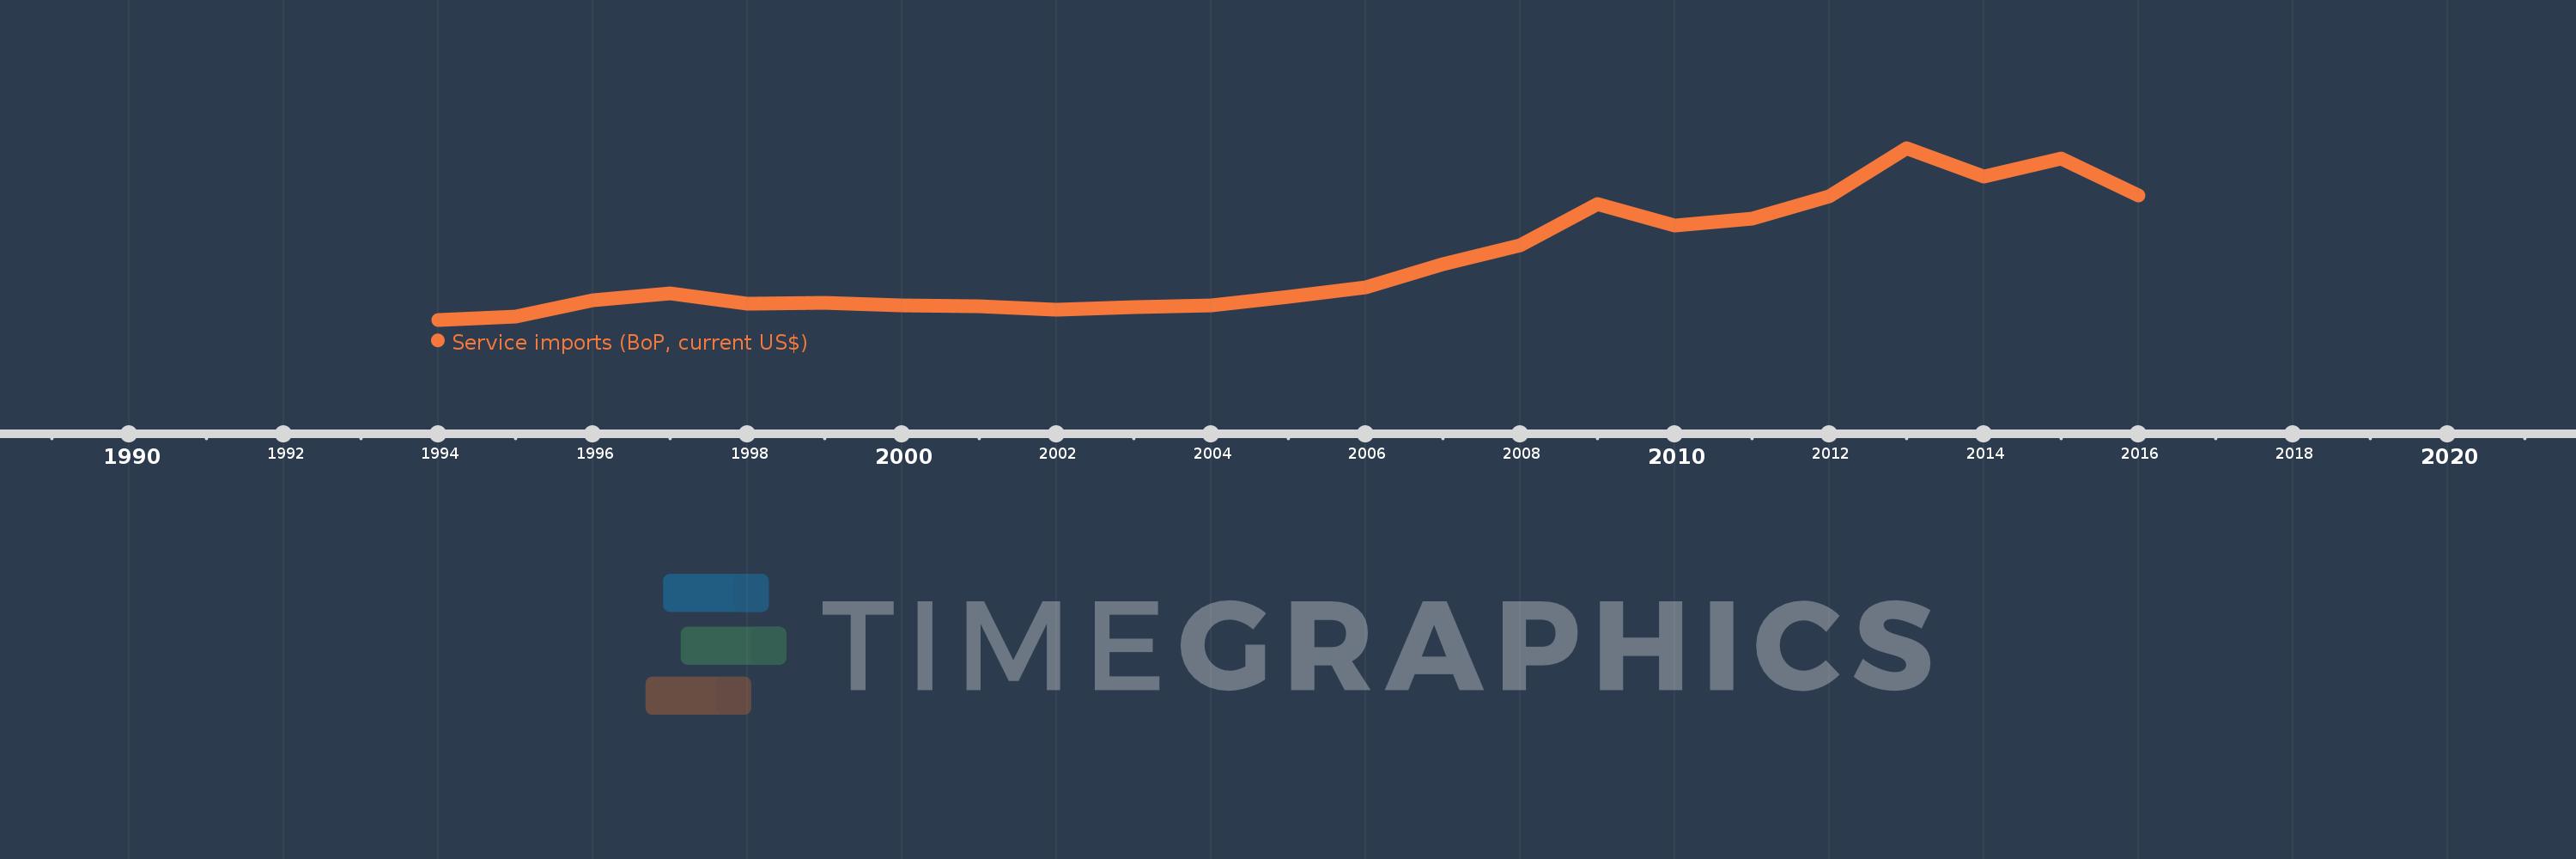
Cette échelle de temps montre un graphique de 1994 année à 2016 année Kyrgyz Republic. Les données jusqu'à 1993 année ne sont pas présentés. Quantité d'observations actuelles selon dates: 23.
Source (désignation):
Les indicateurs du développement mondiale
Source (organisation):
International Monetary Fund, Balance of Payments Statistics Yearbook and data files.
Catégories:
Economy & Growth, Trade
Dernière mise à jour
23 avr. 2017
Les indicateurs de changement de valeurs selon les années
En moyenne:
491.164 mln.
Minimum:
50.738 mln.
1 janv. 1994
Maximum:
1.323 mds
1 janv. 2013
Pour la date d''observation
Valeur
Changement absolu
Le changement par rapport à la valeur précédente
1 janv. 1994
50.738 mln.
+50.738 mln.
0.0%
1 janv. 1995
71.109 mln.
+20.371 mln.
40.15%
1 janv. 1996
195.113 mln.
+124.004 mln.
174.39%
1 janv. 1997
249.018 mln.
+53.905 mln.
27.63%
1 janv. 1998
171.183 mln.
-77.835 mln.
-31.26%
1 janv. 1999
175.655 mln.
+4.472 mln.
2.61%
1 janv. 2000
155.106 mln.
-20.548 mln.
-11.7%
1 janv. 2001
148.176 mln.
-6.931 mln.
-4.47%
1 janv. 2002
124.75 mln.
-23.425 mln.
-15.81%
1 janv. 2003
146.929 mln.
+22.179 mln.
17.78%
1 janv. 2004
159.585 mln.
+12.656 mln.
8.61%
1 janv. 2005
222.649 mln.
+63.064 mln.
39.52%
1 janv. 2006
290.258 mln.
+67.61 mln.
30.37%
1 janv. 2007
459.69 mln.
+169.431 mln.
58.37%
1 janv. 2008
604.492 mln.
+144.802 mln.
31.5%
1 janv. 2009
909.834 mln.
+305.343 mln.
50.51%
1 janv. 2010
746.382 mln.
-163.453 mln.
-17.97%
1 janv. 2011
801.309 mln.
+54.927 mln.
7.36%
1 janv. 2012
963.865 mln.
+162.556 mln.
20.29%
1 janv. 2013
1.323 mds
+359.27 mln.
37.27%
1 janv. 2014
1.109 mds
-213.885 mln.
-16.17%
1 janv. 2015
1.247 mds
+137.58 mln.
12.4%
1 janv. 2016
971.717 mln.
-275.113 mln.
-22.06%
Classement des pays selon les statistiques actuelles par années

Commentaires:

Envoyer
PremiumAbout & FeedbackUn accordConfidentialité
logo
© 2022 Selected Technologies LLC – Morgan Hill, California