29
/fr/
fr
AIzaSyAYiBZKx7MnpbEhh9jyipgxe19OcubqV5w
April 1, 2024
109103
Comoros
COM
true
2
1
Service imports (BoP, current US$)
2013,2012,2011,2010,2009,2008,2007,2006,2005,2004,1996,1995,1994,1993,1992,1991,1990,1989,1988,1987,1986,1985,1984,1983,1982,1981
Download
Bibliothèque de statistiques globales →Comoros →

Service imports (BoP, current US$)

Cette statistique dans les autres pays:
AfghanistanAlbaniaAlgeriaAngolaAntigua and BarbudaArab WorldArgentinaArmeniaArubaAustraliaAustriaAzerbaijanBahamas, TheBahrainBangladeshBarbadosBelarusBelgiumBelizeBeninBermudaBhutanBoliviaBosnia and HerzegovinaBotswanaBrazilBrunei DarussalamBulgariaBurkina FasoBurundiCabo VerdeCambodiaCameroonCanadaCaribbean small statesCentral African RepublicCentral Europe and the BalticsChadChileChinaColombiaComorosCongo, Dem. Rep.Congo, Rep.Costa RicaCote d'IvoireCroatiaCuracaoCyprusCzech RepublicDenmarkDjiboutiDominicaDominican RepublicEarly-demographic dividendEast Asia & PacificEast Asia & Pacific (excluding high income)East Asia & Pacific (IDA & IBRD countries)EcuadorEgypt, Arab Rep.El SalvadorEquatorial GuineaEritreaEstoniaEthiopiaEuro areaEurope & Central AsiaEurope & Central Asia (excluding high income)Europe & Central Asia (IDA & IBRD countries)European UnionFaroe IslandsFijiFinlandFragile and conflict affected situationsFranceFrench PolynesiaGabonGambia, TheGeorgiaGermanyGhanaGreeceGrenadaGuatemalaGuineaGuinea-BissauGuyanaHaitiHeavily indebted poor countries (HIPC)High incomeHondurasHong Kong SAR, ChinaHungaryIBRD onlyIcelandIDA & IBRD totalIDA blendIDA onlyIDA totalIndiaIndonesiaIran, Islamic Rep.IraqIrelandIsraelItalyJamaicaJapanJordanKazakhstanKenyaKiribatiKorea, Rep.KosovoKuwaitKyrgyz RepublicLao PDRLate-demographic dividendLatin America & Caribbean Latin America & Caribbean (excluding high income)Latin America & the Caribbean (IDA & IBRD countries)LatviaLeast developed countries: UN classificationLebanonLesothoLiberiaLibyaLithuaniaLow & middle incomeLow incomeLower middle incomeLuxembourgMacao SAR, ChinaMacedonia, FYRMadagascarMalawiMalaysiaMaldivesMaliMaltaMarshall IslandsMauritaniaMauritiusMexicoMicronesia, Fed. Sts.Middle East & North Africa (excluding high income)Middle East & North Africa (IDA & IBRD countries)Middle incomeMoldovaMongoliaMontenegroMoroccoMozambiqueMyanmarNamibiaNepalNetherlandsNew CaledoniaNew ZealandNicaraguaNigerNigeriaNorth AmericaNorwayOECD membersOmanOther small statesPacific island small statesPakistanPalauPanamaPapua New GuineaParaguayPeruPhilippinesPolandPortugalPost-demographic dividendPre-demographic dividendQatarRomaniaRussian FederationRwandaSamoaSao Tome and PrincipeSaudi ArabiaSenegalSerbiaSeychellesSierra LeoneSingaporeSint Maarten (Dutch part)Slovak RepublicSloveniaSmall statesSolomon IslandsSouth AfricaSouth AsiaSouth Asia (IDA & IBRD)South SudanSpainSri LankaSt. Kitts and NevisSt. LuciaSt. Vincent and the GrenadinesSub-Saharan Africa Sub-Saharan Africa (excluding high income)Sub-Saharan Africa (IDA & IBRD countries)SudanSurinameSwazilandSwedenSwitzerlandSyrian Arab RepublicTajikistanTanzaniaThailandTimor-LesteTogoTongaTrinidad and TobagoTunisiaTurkeyTuvaluUgandaUkraineUnited KingdomUnited StatesUpper middle incomeUruguayVanuatuVenezuela, RBVietnamWest Bank and GazaWorldYemen, Rep.ZambiaZimbabwe
La ligne de temps
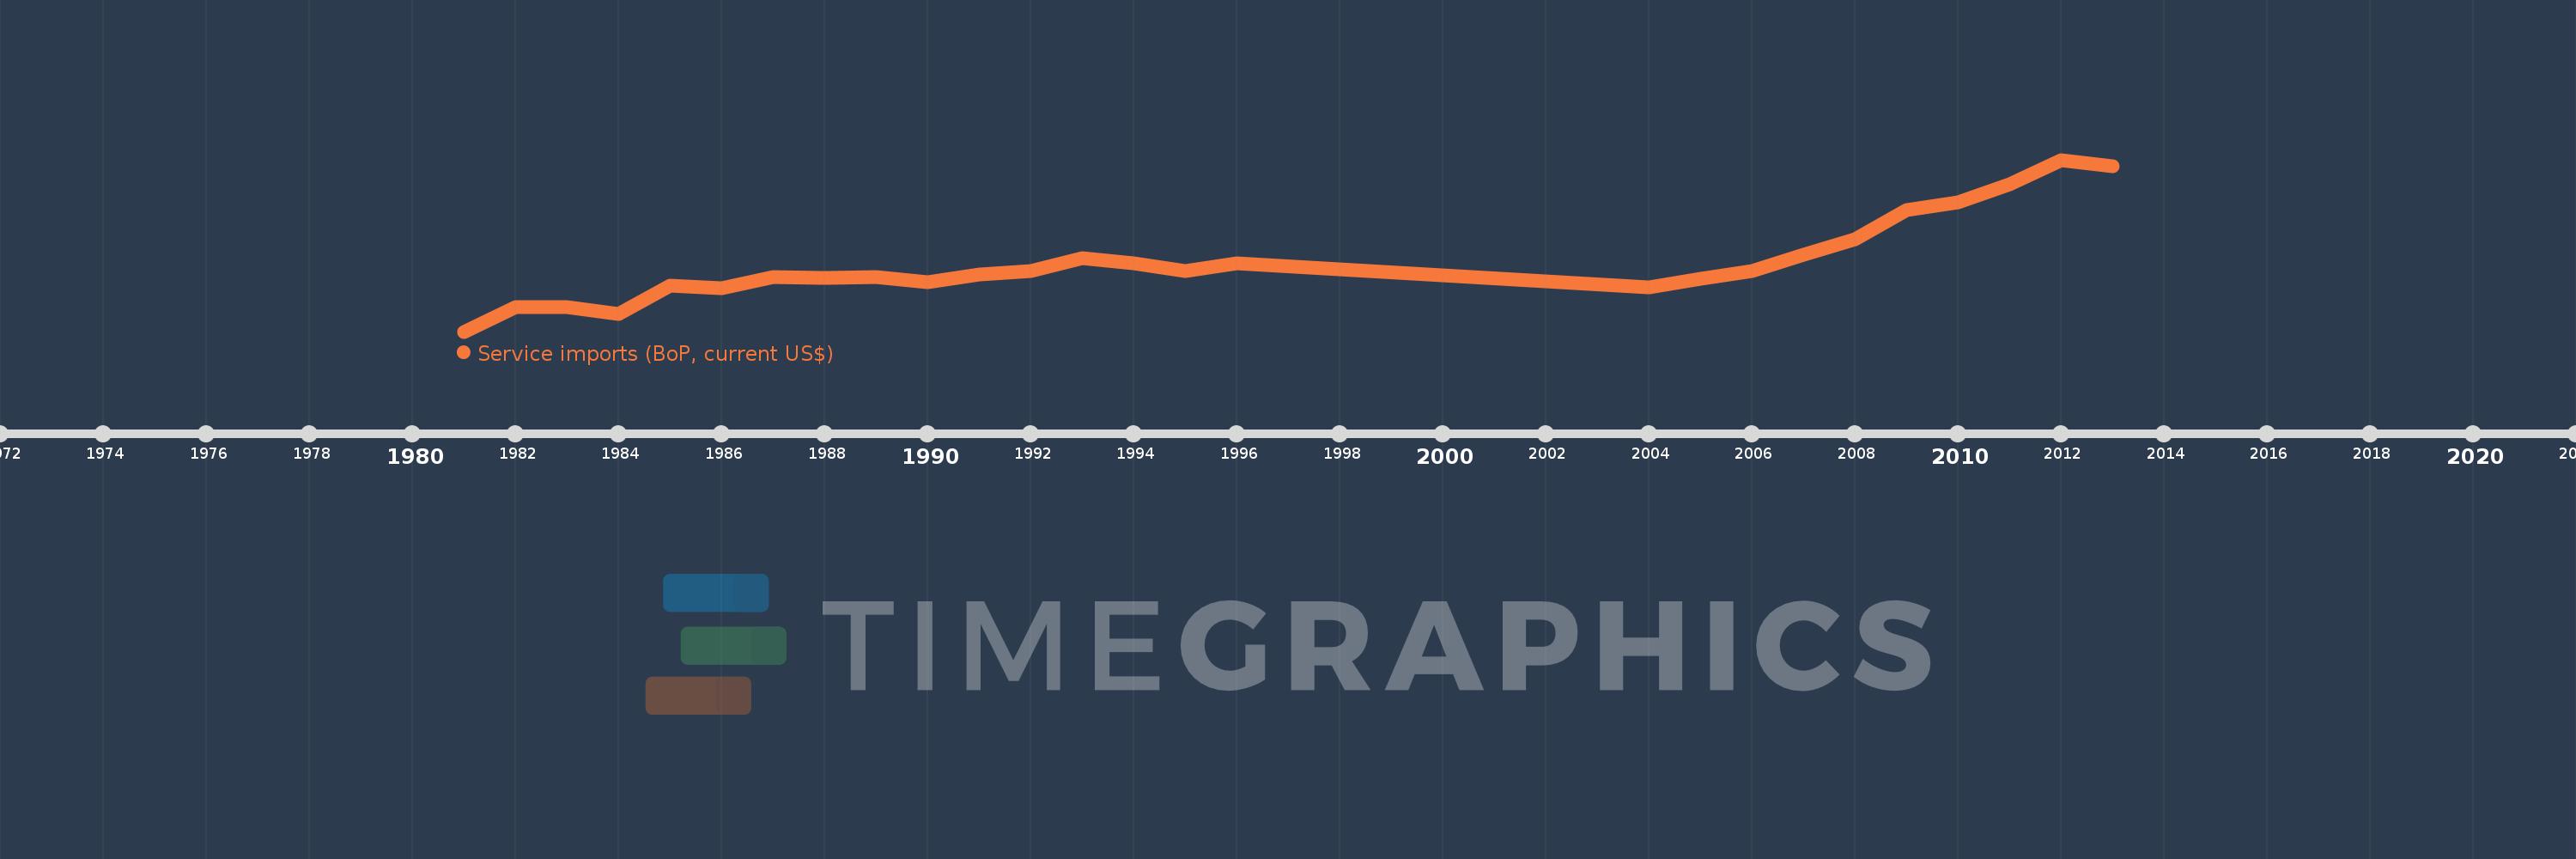
Cette échelle de temps montre un graphique de 1981 année à 2013 année Comoros. Les données jusqu'à 1980 année ne sont pas présentés. Quantité d'observations actuelles selon dates: 26.
Source (désignation):
Les indicateurs du développement mondiale
Source (organisation):
International Monetary Fund, Balance of Payments Statistics Yearbook and data files.
Catégories:
Economy & Growth, Trade
Dernière mise à jour
23 avr. 2017
Les indicateurs de changement de valeurs selon les années
En moyenne:
50.87 mln.
Minimum:
11.918 mln.
1 janv. 1981
Maximum:
107.504 mln.
1 janv. 2012
Pour la date d''observation
Valeur
Changement absolu
Le changement par rapport à la valeur précédente
1 janv. 1981
11.918 mln.
+11.918 mln.
0.0%
1 janv. 1982
25.308 mln.
+13.39 mln.
112.35%
1 janv. 1983
25.414 mln.
+105.319 milles
0.42%
1 janv. 1984
21.855 mln.
-3.559 mln.
-14.0%
1 janv. 1985
37.656 mln.
+15.802 mln.
72.3%
1 janv. 1986
35.892 mln.
-1.764 mln.
-4.68%
1 janv. 1987
42.266 mln.
+6.374 mln.
17.76%
1 janv. 1988
41.802 mln.
-464.202 milles
-1.1%
1 janv. 1989
42.294 mln.
+491.455 milles
1.18%
1 janv. 1990
39.607 mln.
-2.686 mln.
-6.35%
1 janv. 1991
43.925 mln.
+4.317 mln.
10.9%
1 janv. 1992
45.719 mln.
+1.794 mln.
4.08%
1 janv. 1993
52.971 mln.
+7.253 mln.
15.86%
1 janv. 1994
49.866 mln.
-3.106 mln.
-5.86%
1 janv. 1995
45.593 mln.
-4.272 mln.
-8.57%
1 janv. 1996
49.853 mln.
+4.26 mln.
9.34%
1 janv. 2004
36.336 mln.
-13.517 mln.
-27.11%
1 janv. 2005
41.341 mln.
+5.005 mln.
13.77%
1 janv. 2006
45.819 mln.
+4.478 mln.
10.83%
1 janv. 2007
54.922 mln.
+9.104 mln.
19.87%
1 janv. 2008
63.468 mln.
+8.545 mln.
15.56%
1 janv. 2009
79.44 mln.
+15.973 mln.
25.17%
1 janv. 2010
84.037 mln.
+4.597 mln.
5.79%
1 janv. 2011
93.985 mln.
+9.948 mln.
11.84%
1 janv. 2012
107.504 mln.
+13.519 mln.
14.38%
1 janv. 2013
103.816 mln.
-3.688 mln.
-3.43%
Classement des pays selon les statistiques actuelles par années

Commentaires:

Envoyer
PremiumAbout & FeedbackUn accordConfidentialité
logo
© 2022 Selected Technologies LLC – Morgan Hill, California