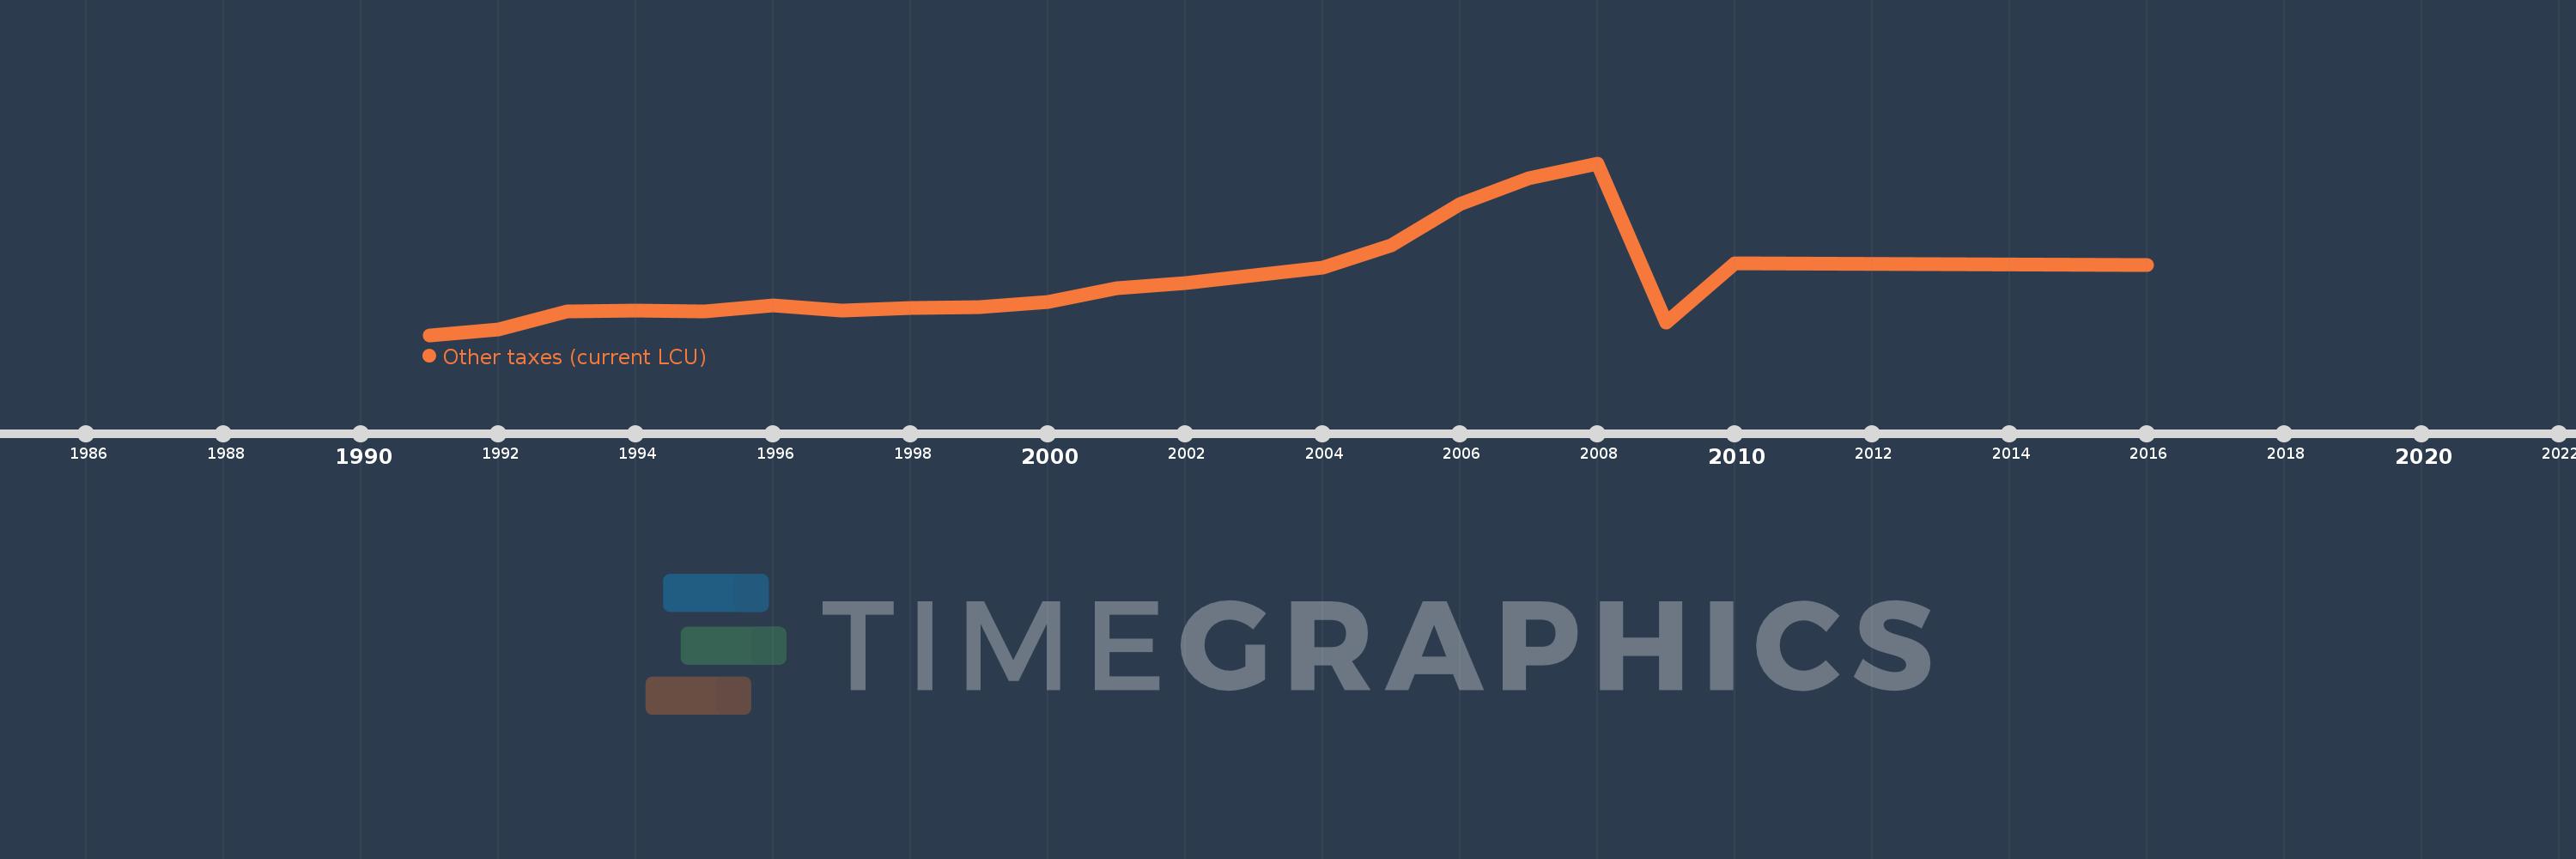
Cette échelle de temps montre un graphique de 1991 année à 2016 année Jordan. Les données jusqu'à 1990 année ne sont pas présentés. Quantité d'observations actuelles selon dates: 21.
Source (désignation):
Les indicateurs du développement mondiale
Source (organisation):
International Monetary Fund, Government Finance Statistics Yearbook and data files.
Catégories:
Public Sector
Dernière mise à jour
23 avr. 2017
Les indicateurs de changement de valeurs selon les années
En moyenne:
103.87 mln.
Minimum:
30.17 mln.
1 janv. 1991
Maximum:
261.0 mln.
1 janv. 2008
Pour la date d''observation
Valeur
Changement absolu
Le changement par rapport à la valeur précédente
1 janv. 1991
30.17 mln.
+30.17 mln.
0.0%
1 janv. 1992
37.24 mln.
+7.07 mln.
23.43%
1 janv. 1993
62.4 mln.
+25.16 mln.
67.56%
1 janv. 1994
63.55 mln.
+1.15 mln.
1.84%
1 janv. 1995
62.21 mln.
-1.34 mln.
-2.11%
1 janv. 1996
70.56 mln.
+8.35 mln.
13.42%
1 janv. 1997
63.5 mln.
-7.06 mln.
-10.01%
1 janv. 1998
66.8 mln.
+3.3 mln.
5.2%
1 janv. 1999
67.28 mln.
+480.0 milles
0.72%
1 janv. 2000
74.78 mln.
+7.5 mln.
11.15%
1 janv. 2001
92.74 mln.
+17.96 mln.
24.02%
1 janv. 2002
100.41 mln.
+7.67 mln.
8.27%
1 janv. 2003
110.75 mln.
+10.34 mln.
10.3%
1 janv. 2004
121.01 mln.
+10.26 mln.
9.26%
1 janv. 2005
151.322 mln.
+30.312 mln.
25.05%
1 janv. 2006
206.5 mln.
+55.178 mln.
36.46%
1 janv. 2007
240.84 mln.
+34.34 mln.
16.63%
1 janv. 2008
261.0 mln.
+20.16 mln.
8.37%
1 janv. 2009
46.8 mln.
-214.2 mln.
-82.07%
1 janv. 2010
126.6 mln.
+79.8 mln.
170.51%
1 janv. 2016
124.8 mln.
-1.8 mln.
-1.42%
Classement des pays selon les statistiques actuelles par années