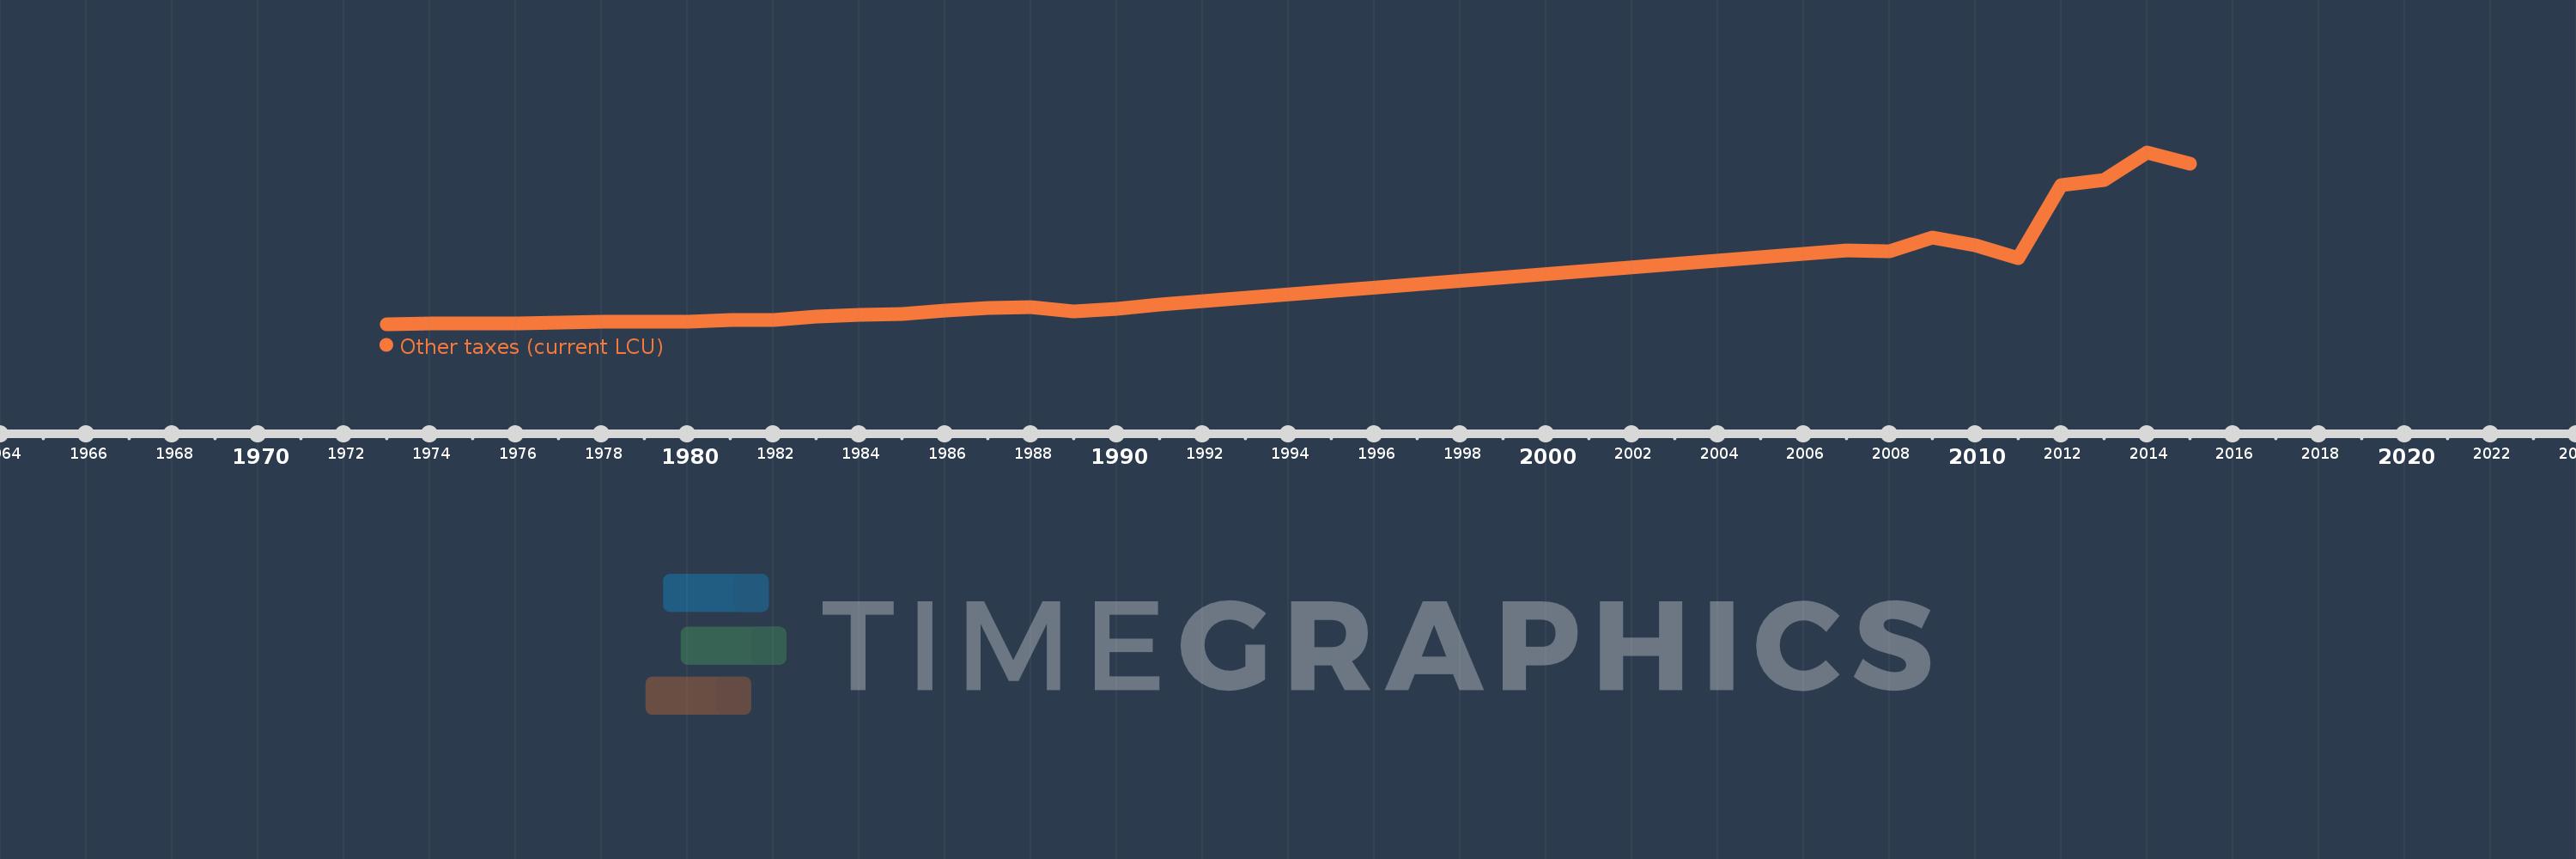
Cette échelle de temps montre un graphique de 1973 année à 2015 année Greece. Les données jusqu'à 1972 année ne sont pas présentés. Quantité d'observations actuelles selon dates: 28.
Source (désignation):
Les indicateurs du développement mondiale
Source (organisation):
International Monetary Fund, Government Finance Statistics Yearbook and data files.
Catégories:
Public Sector
Dernière mise à jour
23 avr. 2017
Les indicateurs de changement de valeurs selon les années
En moyenne:
927.598 mln.
Minimum:
24.71 mln.
1 janv. 1973
Maximum:
3.85 mds
1 janv. 2014
Pour la date d''observation
Valeur
Changement absolu
Le changement par rapport à la valeur précédente
1 janv. 1973
24.71 mln.
+24.71 mln.
0.0%
1 janv. 1974
33.25 mln.
+8.54 mln.
34.56%
1 janv. 1975
36.273 mln.
+3.023 mln.
9.09%
1 janv. 1976
49.773 mln.
+13.5 mln.
37.22%
1 janv. 1977
60.103 mln.
+10.33 mln.
20.75%
1 janv. 1978
73.25 mln.
+13.147 mln.
21.88%
1 janv. 1979
85.282 mln.
+12.032 mln.
16.43%
1 janv. 1980
84.813 mln.
-469.552 milles
-0.55%
1 janv. 1981
121.526 mln.
+36.713 mln.
43.29%
1 janv. 1982
109.963 mln.
-11.563 mln.
-9.51%
1 janv. 1983
191.284 mln.
+81.321 mln.
73.95%
1 janv. 1984
224.974 mln.
+33.69 mln.
17.61%
1 janv. 1985
243.199 mln.
+18.225 mln.
8.1%
1 janv. 1986
320.411 mln.
+77.212 mln.
31.75%
1 janv. 1987
385.356 mln.
+64.945 mln.
20.27%
1 janv. 1988
405.371 mln.
+20.015 mln.
5.19%
1 janv. 1989
306.941 mln.
-98.43 mln.
-24.28%
1 janv. 1990
366.192 mln.
+59.252 mln.
19.3%
1 janv. 1991
459.076 mln.
+92.883 mln.
25.36%
1 janv. 2007
1.667 mds
+1.208 mds
263.12%
1 janv. 2008
1.657 mds
-10.0 mln.
-0.6%
1 janv. 2009
1.959 mds
+302.0 mln.
18.23%
1 janv. 2010
1.778 mds
-181.0 mln.
-9.24%
1 janv. 2011
1.503 mds
-275.0 mln.
-15.47%
1 janv. 2012
3.127 mds
+1.624 mds
108.05%
1 janv. 2013
3.245 mds
+118.0 mln.
3.77%
1 janv. 2014
3.85 mds
+605.0 mln.
18.64%
1 janv. 2015
3.605 mds
-245.0 mln.
-6.36%
Classement des pays selon les statistiques actuelles par années