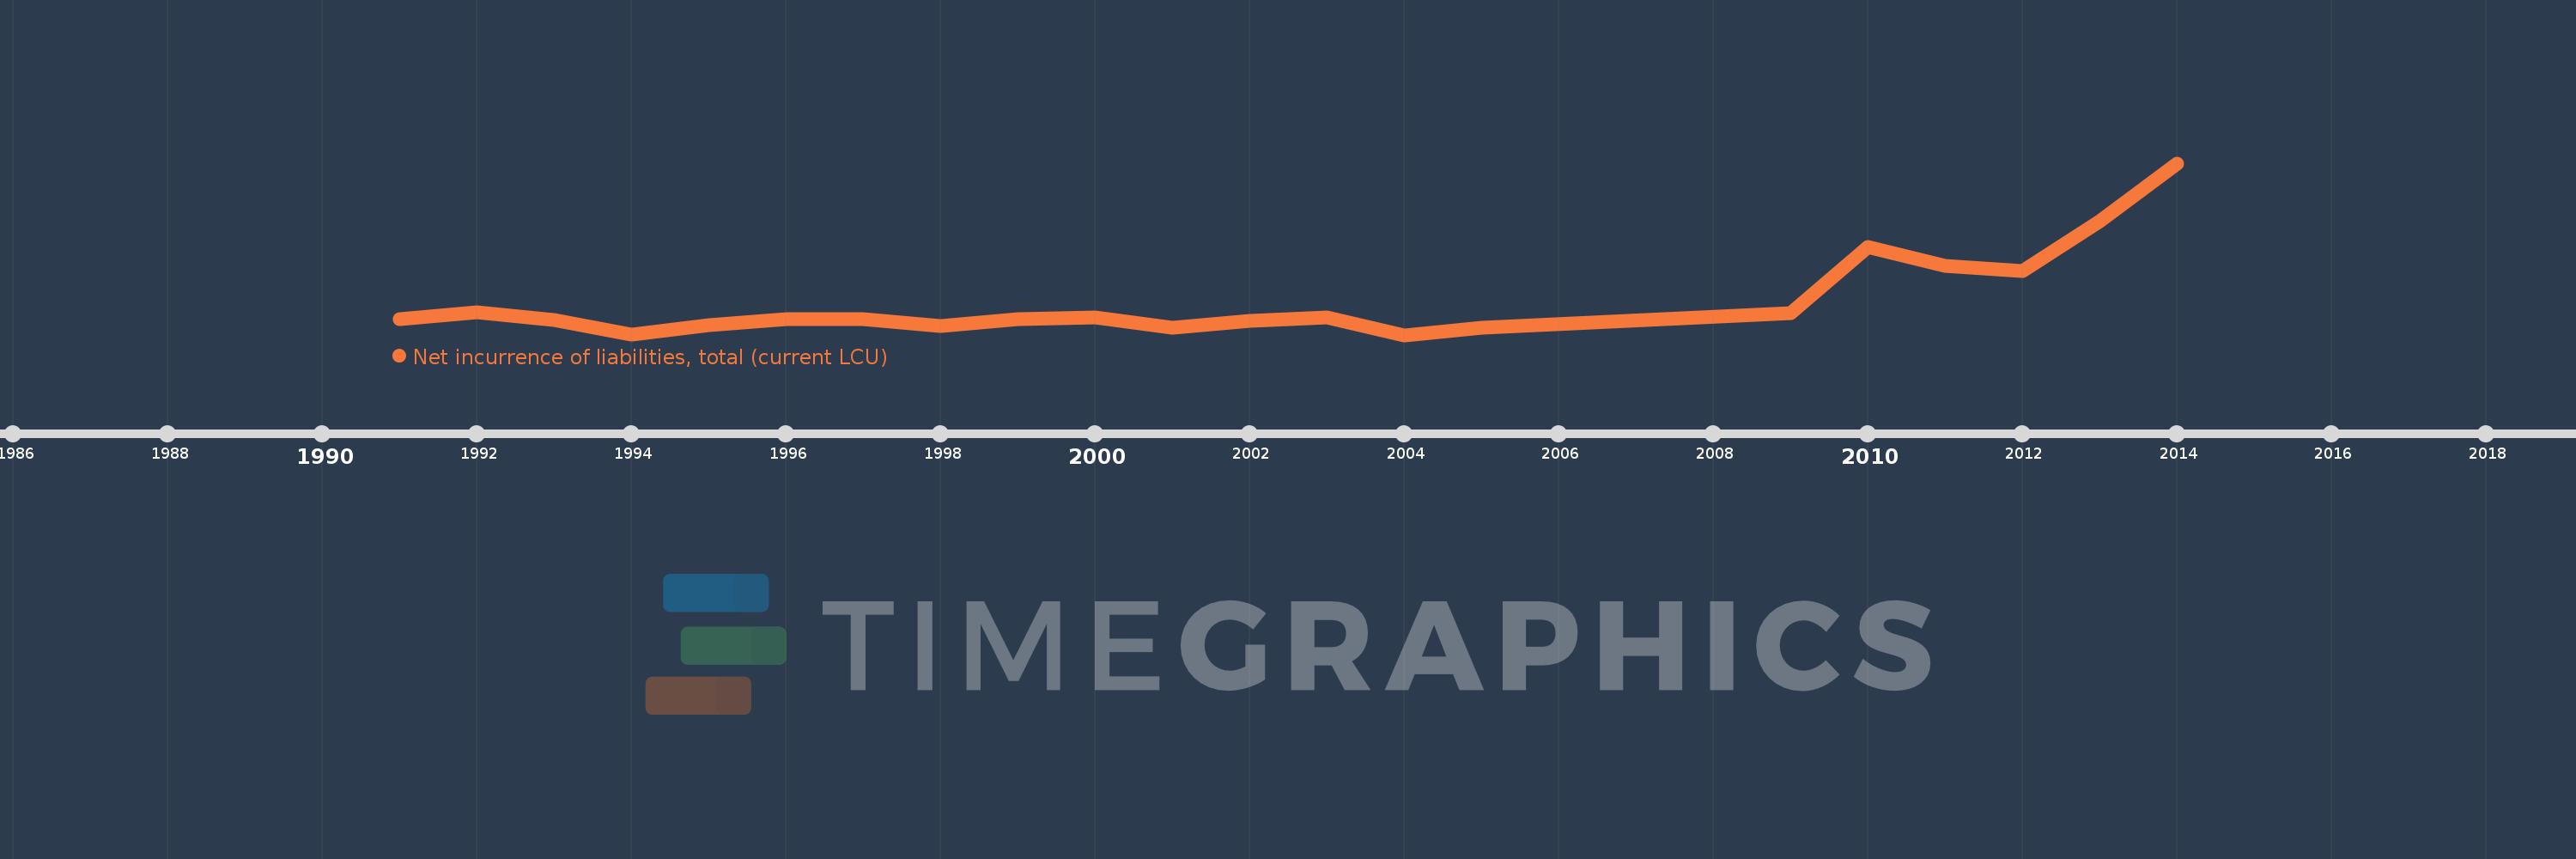
Cette échelle de temps montre un graphique de 1991 année à 2014 année Jordan. Les données jusqu'à 1990 année ne sont pas présentés. Quantité d'observations actuelles selon dates: 21.
Source (désignation):
Les indicateurs du développement mondiale
Source (organisation):
International Monetary Fund, Government Finance Statistics Yearbook and data files.
Catégories:
Public Sector
Dernière mise à jour
23 avr. 2017
Les indicateurs de changement de valeurs selon les années
En moyenne:
521.098 mln.
Minimum:
-132.89 mln.
1 janv. 2004
Maximum:
3.171 mds
1 janv. 2014
Pour la date d''observation
Valeur
Changement absolu
Le changement par rapport à la valeur précédente
1 janv. 1991
178.41 mln.
+178.41 mln.
0.0%
1 janv. 1992
301.46 mln.
+123.05 mln.
68.97%
1 janv. 1993
148.2 mln.
-153.26 mln.
-50.84%
1 janv. 1994
-132.27 mln.
-280.47 mln.
-189.25%
1 janv. 1995
59.9 mln.
+192.17 mln.
-145.29%
1 janv. 1996
168.84 mln.
+108.94 mln.
181.87%
1 janv. 1997
175.45 mln.
+6.61 mln.
3.91%
1 janv. 1998
45.68 mln.
-129.77 mln.
-73.96%
1 janv. 1999
180.45 mln.
+134.77 mln.
295.03%
1 janv. 2000
204.34 mln.
+23.89 mln.
13.24%
1 janv. 2001
5.55 mln.
-198.79 mln.
-97.28%
1 janv. 2002
139.44 mln.
+133.89 mln.
2.41 milles%
1 janv. 2003
203.0 mln.
+63.56 mln.
45.58%
1 janv. 2004
-132.89 mln.
-335.89 mln.
-165.46%
1 janv. 2005
5.99 mln.
+138.88 mln.
-104.51%
1 janv. 2009
290.4 mln.
+284.41 mln.
4.75 milles%
1 janv. 2010
1.567 mds
+1.276 mds
439.5%
1 janv. 2011
1.197 mds
-369.5 mln.
-23.58%
1 janv. 2012
1.105 mds
-91.9 mln.
-7.68%
1 janv. 2013
2.061 mds
+955.3 mln.
86.43%
1 janv. 2014
3.171 mds
+1.111 mds
53.9%
Classement des pays selon les statistiques actuelles par années