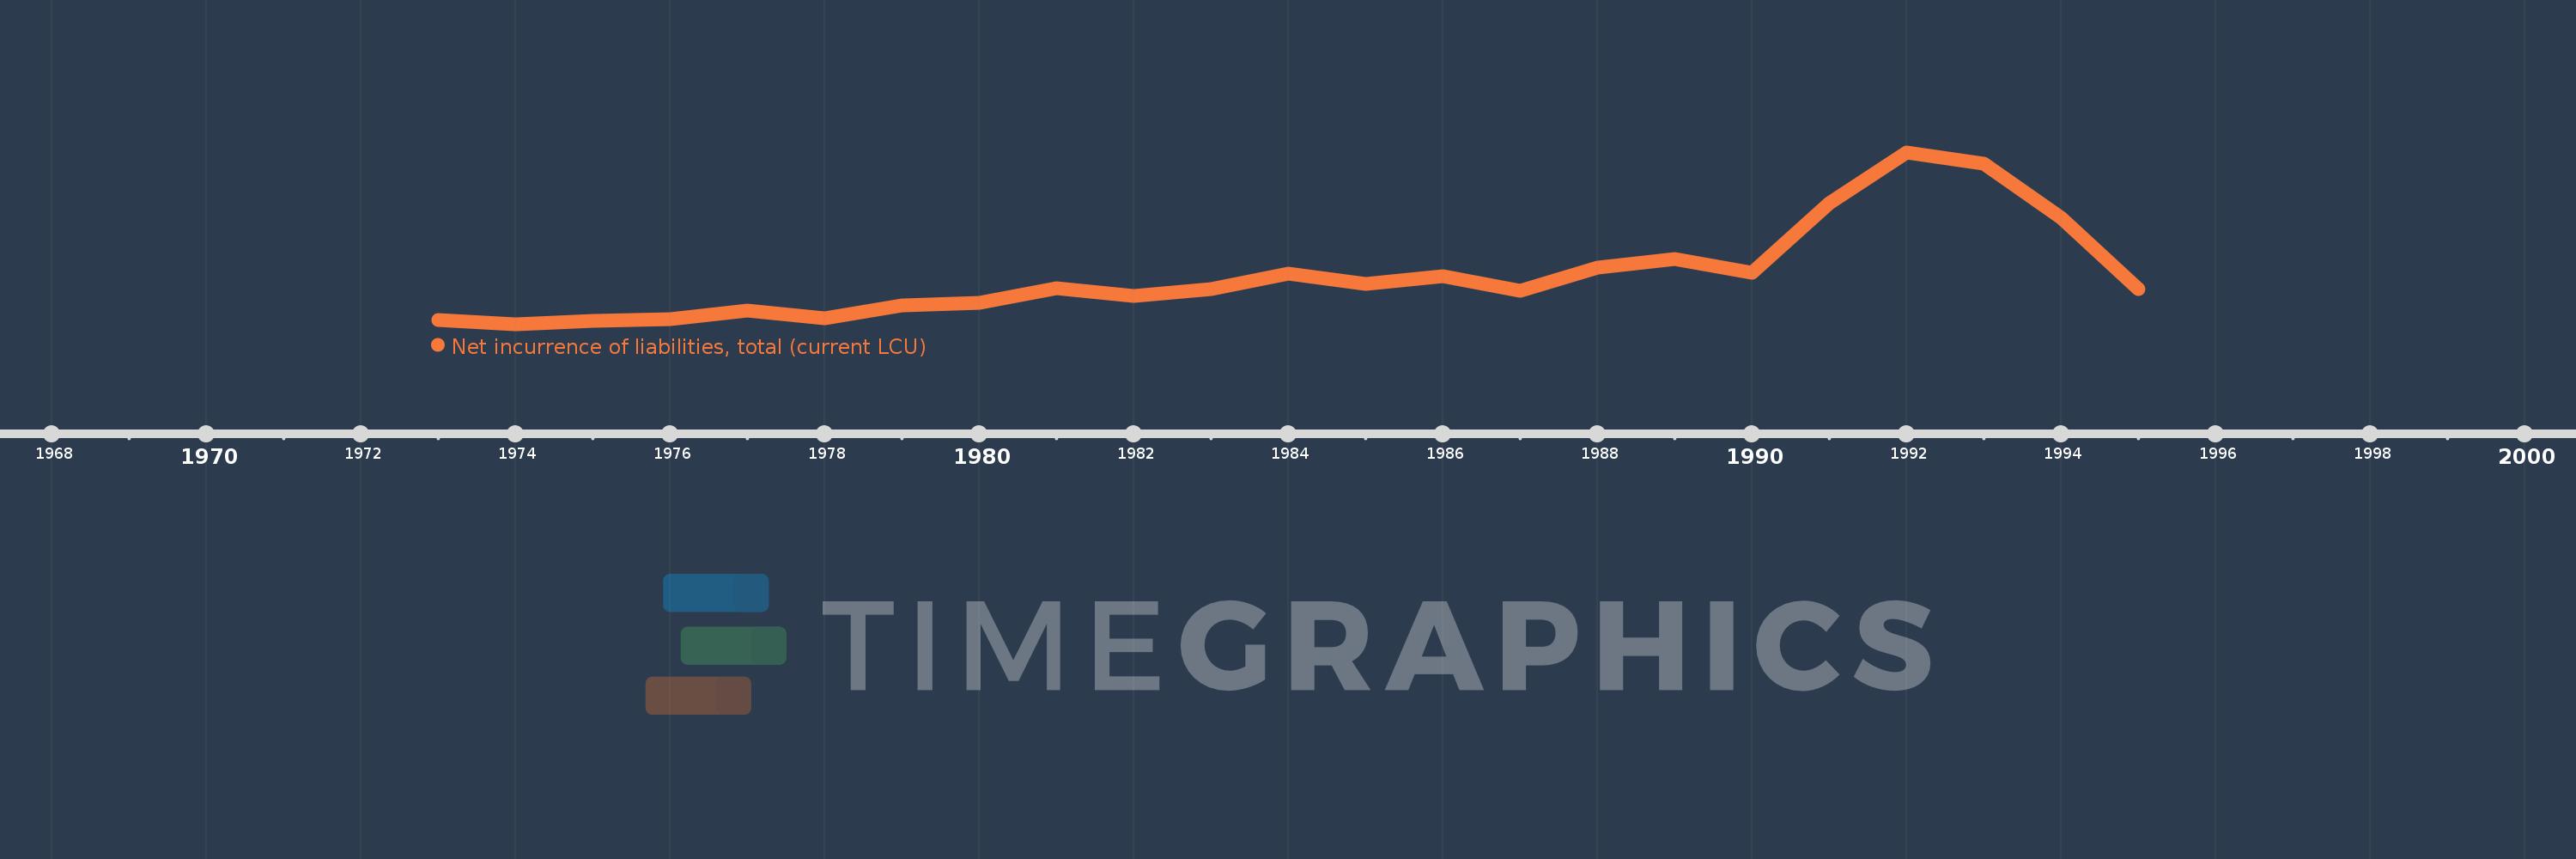
Cette échelle de temps montre un graphique de 1973 année à 1995 année Cyprus. Les données jusqu'à 1972 année ne sont pas présentés. Quantité d'observations actuelles selon dates: 23.
Source (désignation):
Les indicateurs du développement mondiale
Source (organisation):
International Monetary Fund, Government Finance Statistics Yearbook and data files.
Catégories:
Public Sector
Dernière mise à jour
23 avr. 2017
Les indicateurs de changement de valeurs selon les années
En moyenne:
167.972 mln.
Minimum:
-4.835 mln.
1 janv. 1974
Maximum:
608.97 mln.
1 janv. 1992
Pour la date d''observation
Valeur
Changement absolu
Le changement par rapport à la valeur précédente
1 janv. 1973
11.465 mln.
+11.465 mln.
0.0%
1 janv. 1974
-4.835 mln.
-16.3 mln.
-142.18%
1 janv. 1975
6.527 mln.
+11.362 mln.
-234.98%
1 janv. 1976
12.644 mln.
+6.117 mln.
93.72%
1 janv. 1977
43.313 mln.
+30.669 mln.
242.57%
1 janv. 1978
17.394 mln.
-25.919 mln.
-59.84%
1 janv. 1979
63.782 mln.
+46.389 mln.
266.7%
1 janv. 1980
70.172 mln.
+6.39 mln.
10.02%
1 janv. 1981
124.779 mln.
+54.607 mln.
77.82%
1 janv. 1982
95.75 mln.
-29.029 mln.
-23.26%
1 janv. 1983
121.977 mln.
+26.227 mln.
27.39%
1 janv. 1984
175.234 mln.
+53.257 mln.
43.66%
1 janv. 1985
137.713 mln.
-37.521 mln.
-21.41%
1 janv. 1986
166.691 mln.
+28.978 mln.
21.04%
1 janv. 1987
113.947 mln.
-52.745 mln.
-31.64%
1 janv. 1988
197.531 mln.
+83.585 mln.
73.35%
1 janv. 1989
228.269 mln.
+30.738 mln.
15.56%
1 janv. 1990
179.967 mln.
-48.302 mln.
-21.16%
1 janv. 1991
426.746 mln.
+246.779 mln.
137.12%
1 janv. 1992
608.97 mln.
+182.224 mln.
42.7%
1 janv. 1993
567.516 mln.
-41.454 mln.
-6.81%
1 janv. 1994
375.775 mln.
-191.741 mln.
-33.79%
1 janv. 1995
122.028 mln.
-253.747 mln.
-67.53%
Classement des pays selon les statistiques actuelles par années