33
/fr/
AIzaSyAYiBZKx7MnpbEhh9jyipgxe19OcubqV5w
August 1, 2025
160942
Israel
ISR
true
2
1
Rail lines (total route-km)
2015,2014,2013,2012,2011,2010,2009,2008,2007,2006,2005,2003,2002,1998,1996,1995,1994,1993,1992,1991,1989,1988,1987,1986,1985,1984,1983,1982
Download
Bibliothèque de statistiques globales →Israel →

Rail lines (total route-km)

Cette statistique dans les autres pays:

AlbaniaAlgeriaArab WorldArgentinaArmeniaAustraliaAustriaAzerbaijanBangladeshBelarusBelgiumBeninBoliviaBosnia and HerzegovinaBotswanaBrazilBulgariaBurkina FasoCambodiaCameroonCanadaCentral Europe and the BalticsChileChinaColombiaCongo, Dem. Rep.Congo, Rep.Costa RicaCote d'IvoireCroatiaCubaCzech RepublicDenmarkDjiboutiEarly-demographic dividendEast Asia & PacificEast Asia & Pacific (excluding high income)East Asia & Pacific (IDA & IBRD countries)Egypt, Arab Rep.EstoniaEthiopiaEuro areaEurope & Central AsiaEurope & Central Asia (excluding high income)Europe & Central Asia (IDA & IBRD countries)European UnionFinlandFragile and conflict affected situationsFranceGabonGeorgiaGermanyGhanaGreeceHeavily indebted poor countries (HIPC)High incomeHungaryIBRD onlyIDA & IBRD totalIDA blendIDA onlyIDA totalIndiaIndonesiaIran, Islamic Rep.IraqIrelandIsraelItalyJapanJordanKazakhstanKenyaKorea, Rep.Kyrgyz RepublicLate-demographic dividendLatin America & Caribbean Latin America & Caribbean (excluding high income)Latin America & the Caribbean (IDA & IBRD countries)LatviaLeast developed countries: UN classificationLithuaniaLow & middle incomeLow incomeLower middle incomeLuxembourgMacedonia, FYRMadagascarMalawiMalaysiaMaliMauritaniaMexicoMiddle East & North AfricaMiddle East & North Africa (excluding high income)Middle East & North Africa (IDA & IBRD countries)Middle incomeMoldovaMongoliaMoroccoMozambiqueMyanmarNamibiaNetherlandsNew ZealandNigeriaNorth AmericaNorwayOECD membersOther small statesPakistanPeruPhilippinesPolandPortugalPost-demographic dividendPre-demographic dividendRomaniaRussian FederationSaudi ArabiaSenegalSerbiaSlovak RepublicSloveniaSmall statesSouth AfricaSouth AsiaSouth Asia (IDA & IBRD)SpainSri LankaSub-Saharan Africa Sub-Saharan Africa (excluding high income)Sub-Saharan Africa (IDA & IBRD countries)SudanSwazilandSwedenSwitzerlandSyrian Arab RepublicTajikistanTanzaniaThailandTunisiaTurkeyTurkmenistanUgandaUkraineUnited KingdomUnited StatesUpper middle incomeUruguayUzbekistanVenezuela, RBVietnamWorldZambiaZimbabwe

La ligne de temps

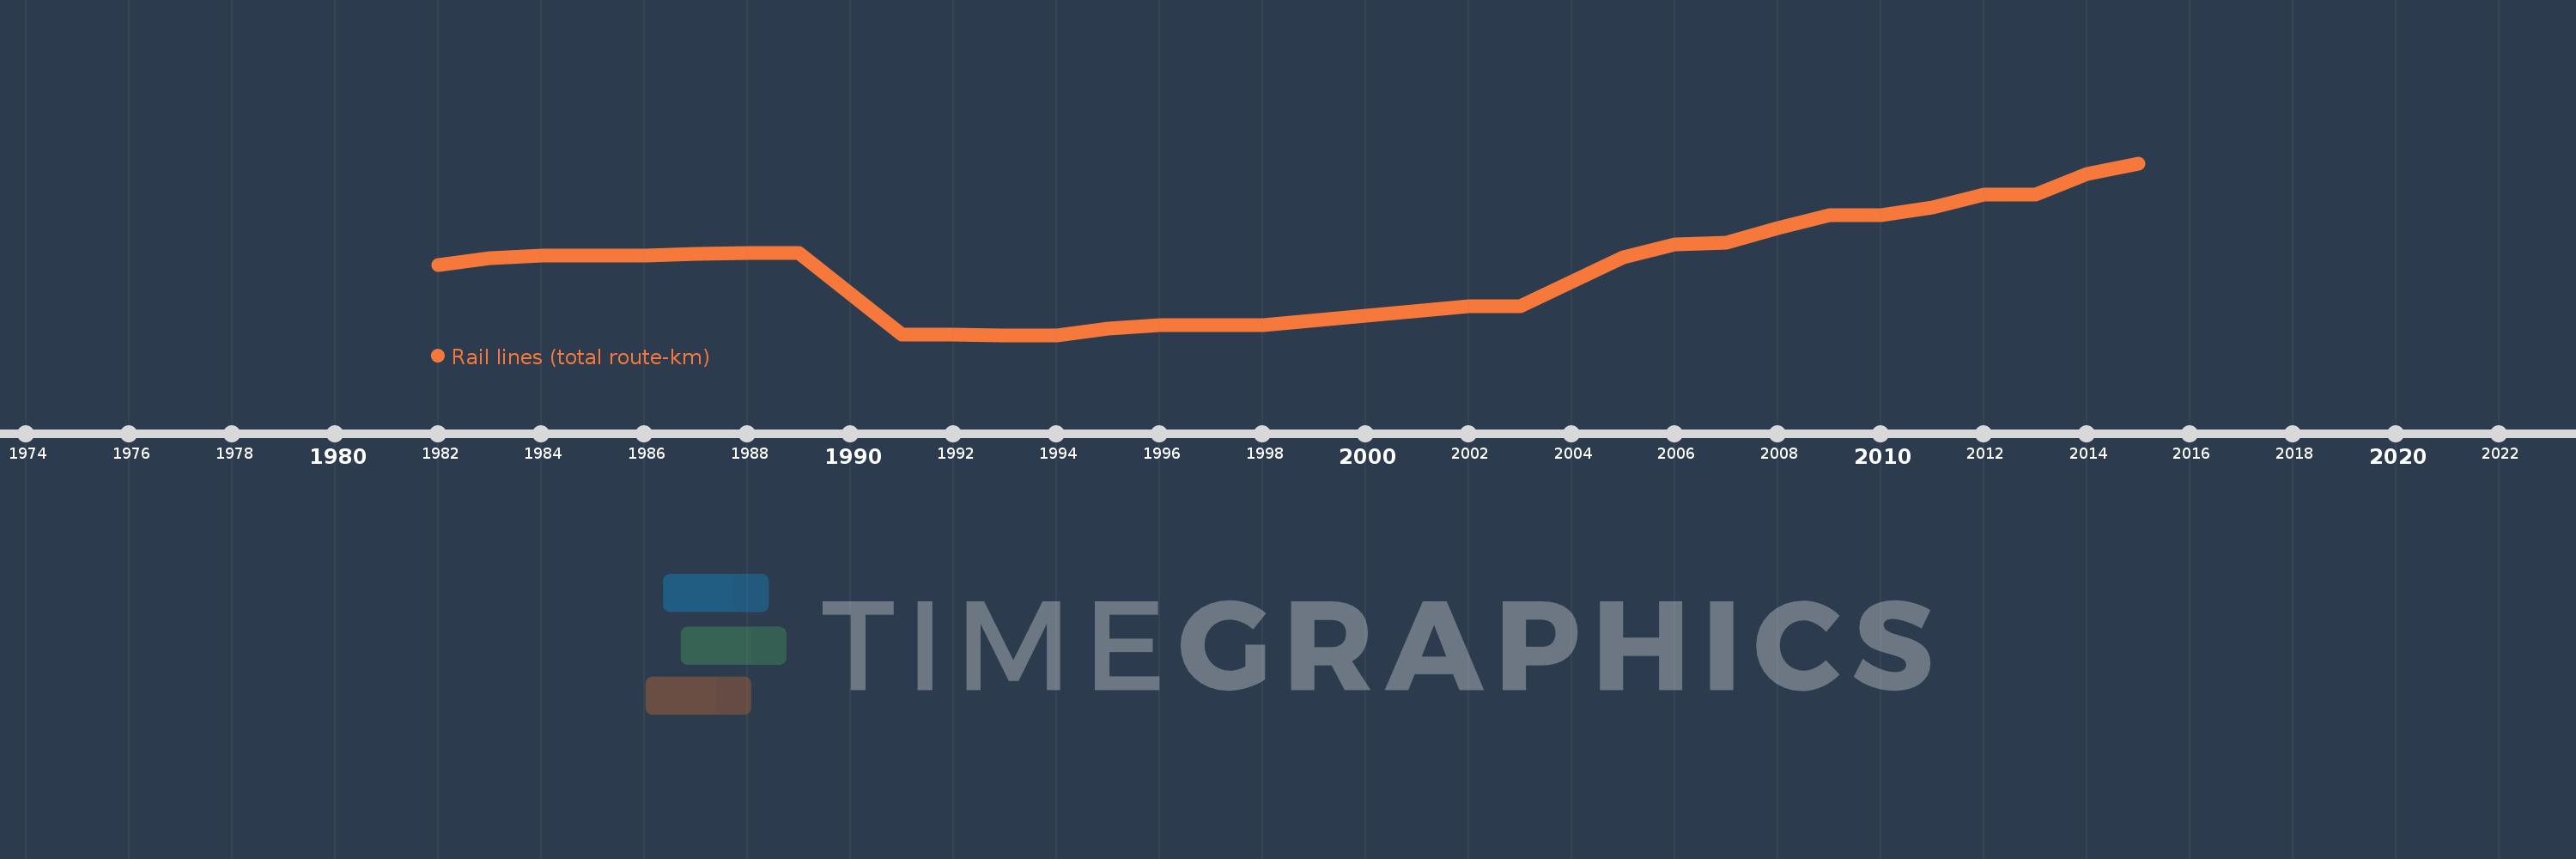
Cette échelle de temps montre un graphique de 1982 année à 2015 année Israel. Les données jusqu'à 1981 année ne sont pas présentés. Quantité d'observations actuelles selon dates: 28.

Source (désignation):

Les indicateurs du développement mondiale

Source (organisation):

World Bank, Transportation, Water, and Information and Communications Technologies Department, Transport Division.

Catégories:

Infrastructure

Dernière mise à jour

23 avr. 2017

Les indicateurs de changement de valeurs selon les années

En moyenne:
838.679
Minimum:
573.0
1 janv. 1993
Maximum:
1.193 milles
1 janv. 2015
Pour la date d''observation
Valeur
Changement absolu
Le changement par rapport à la valeur précédente
1 janv. 1982
827.0
+827.0
0.0%
1 janv. 1983
851.0
+24.0
2.9%
1 janv. 1984
859.0
+8.0
0.94%
1 janv. 1985
859.0
0.0
0.0%
1 janv. 1986
859.0
0.0
0.0%
1 janv. 1987
865.0
+6.0
0.7%
1 janv. 1988
869.0
+4.0
0.46%
1 janv. 1989
869.0
0.0
0.0%
1 janv. 1991
574.0
-295.0
-33.95%
1 janv. 1992
574.0
0.0
0.0%
1 janv. 1993
573.0
-1.0
-0.17%
1 janv. 1994
573.0
0.0
0.0%
1 janv. 1995
596.0
+23.0
4.01%
1 janv. 1996
610.0
+14.0
2.35%
1 janv. 1998
610.0
0.0
0.0%
1 janv. 2002
676.0
+66.0
10.82%
1 janv. 2003
676.0
0.0
0.0%
1 janv. 2005
853.0
+177.0
26.18%
1 janv. 2006
899.0
+46.0
5.39%
1 janv. 2007
905.0
+6.0
0.67%
1 janv. 2008
958.0
+53.0
5.86%
1 janv. 2009
1.005 milles
+47.0
4.91%
1 janv. 2010
1.005 milles
0.0
0.0%
1 janv. 2011
1.034 milles
+29.0
2.89%
1 janv. 2012
1.079 milles
+45.0
4.35%
1 janv. 2013
1.079 milles
0.0
0.0%
1 janv. 2014
1.153 milles
+74.0
6.86%
1 janv. 2015
1.193 milles
+40.0
3.47%

Classement des pays selon les statistiques actuelles par années