29
/fr/
fr
AIzaSyAYiBZKx7MnpbEhh9jyipgxe19OcubqV5w
April 1, 2024
111570
Congo, Rep.
COG
true
2
1
Rail lines (total route-km)
2009,2008,2007,2006,2005,2003,2002,2001,1996,1995,1994,1993,1992,1990,1989,1988,1987,1986,1985,1984,1983,1982,1981
Download
Bibliothèque de statistiques globales →Congo, Rep. →

Rail lines (total route-km)

Cette statistique dans les autres pays:
AlbaniaAlgeriaArab WorldArgentinaArmeniaAustraliaAustriaAzerbaijanBangladeshBelarusBelgiumBeninBoliviaBosnia and HerzegovinaBotswanaBrazilBulgariaBurkina FasoCambodiaCameroonCanadaCentral Europe and the BalticsChileChinaColombiaCongo, Dem. Rep.Congo, Rep.Costa RicaCote d'IvoireCroatiaCubaCzech RepublicDenmarkDjiboutiEarly-demographic dividendEast Asia & PacificEast Asia & Pacific (excluding high income)East Asia & Pacific (IDA & IBRD countries)Egypt, Arab Rep.EstoniaEthiopiaEuro areaEurope & Central AsiaEurope & Central Asia (excluding high income)Europe & Central Asia (IDA & IBRD countries)European UnionFinlandFragile and conflict affected situationsFranceGabonGeorgiaGermanyGhanaGreeceHeavily indebted poor countries (HIPC)High incomeHungaryIBRD onlyIDA & IBRD totalIDA blendIDA onlyIDA totalIndiaIndonesiaIran, Islamic Rep.IraqIrelandIsraelItalyJapanJordanKazakhstanKenyaKorea, Rep.Kyrgyz RepublicLate-demographic dividendLatin America & Caribbean Latin America & Caribbean (excluding high income)Latin America & the Caribbean (IDA & IBRD countries)LatviaLeast developed countries: UN classificationLithuaniaLow & middle incomeLow incomeLower middle incomeLuxembourgMacedonia, FYRMadagascarMalawiMalaysiaMaliMauritaniaMexicoMiddle East & North AfricaMiddle East & North Africa (excluding high income)Middle East & North Africa (IDA & IBRD countries)Middle incomeMoldovaMongoliaMoroccoMozambiqueMyanmarNamibiaNetherlandsNew ZealandNigeriaNorth AmericaNorwayOECD membersOther small statesPakistanPeruPhilippinesPolandPortugalPost-demographic dividendPre-demographic dividendRomaniaRussian FederationSaudi ArabiaSenegalSerbiaSlovak RepublicSloveniaSmall statesSouth AfricaSouth AsiaSouth Asia (IDA & IBRD)SpainSri LankaSub-Saharan Africa Sub-Saharan Africa (excluding high income)Sub-Saharan Africa (IDA & IBRD countries)SudanSwazilandSwedenSwitzerlandSyrian Arab RepublicTajikistanTanzaniaThailandTunisiaTurkeyTurkmenistanUgandaUkraineUnited KingdomUnited StatesUpper middle incomeUruguayUzbekistanVenezuela, RBVietnamWorldZambiaZimbabwe
La ligne de temps
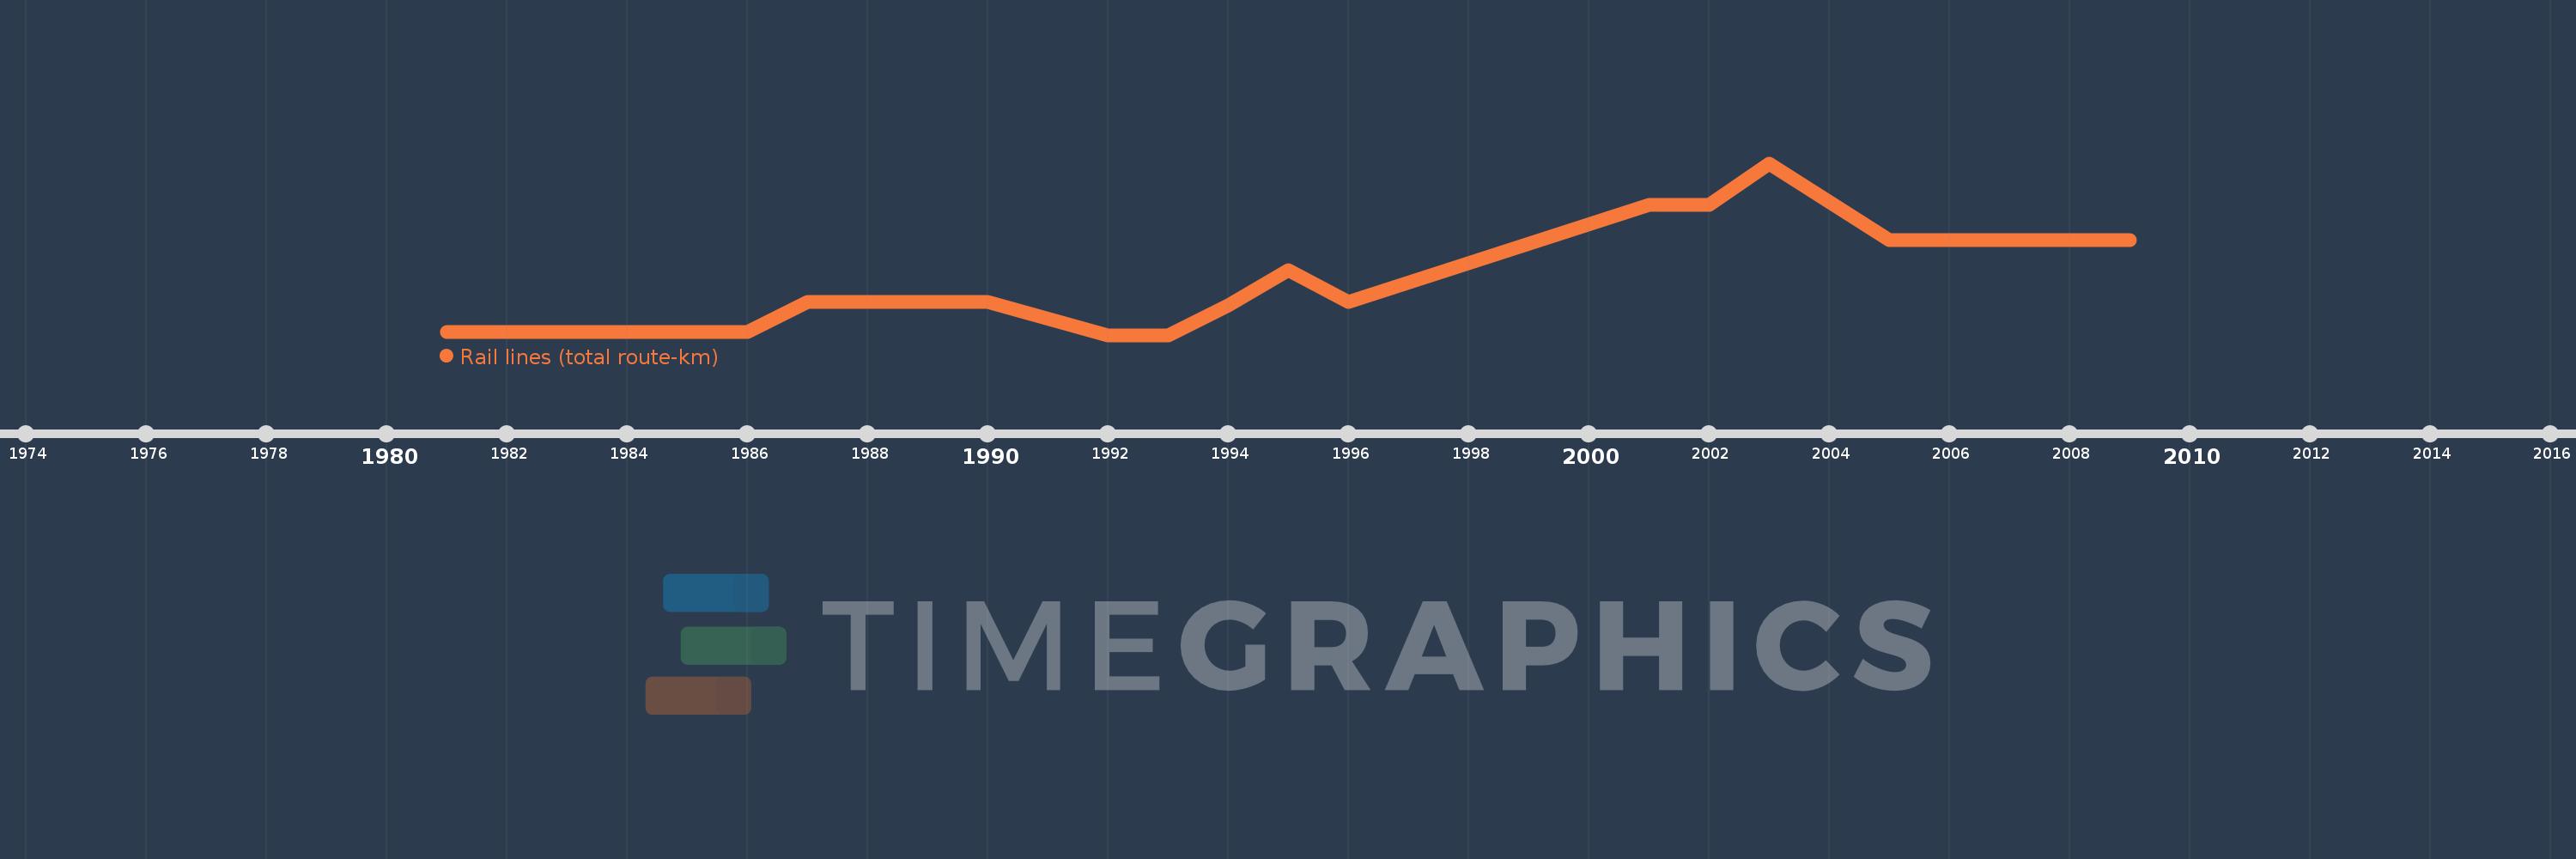
Cette échelle de temps montre un graphique de 1981 année à 2009 année Congo, Rep.. Les données jusqu'à 1980 année ne sont pas présentés. Quantité d'observations actuelles selon dates: 23.
Source (désignation):
Les indicateurs du développement mondiale
Source (organisation):
World Bank, Transportation, Water, and Information and Communications Technologies Department, Transport Division.
Catégories:
Infrastructure
Dernière mise à jour
23 avr. 2017
Les indicateurs de changement de valeurs selon les années
En moyenne:
664.652
Minimum:
510.0
1 janv. 1992
Maximum:
1.026 milles
1 janv. 2003
Pour la date d''observation
Valeur
Changement absolu
Le changement par rapport à la valeur précédente
1 janv. 1981
519.0
+519.0
0.0%
1 janv. 1982
519.0
0.0
0.0%
1 janv. 1983
519.0
0.0
0.0%
1 janv. 1984
519.0
0.0
0.0%
1 janv. 1985
518.5
-0.5
-0.1%
1 janv. 1986
518.5
0.0
0.0%
1 janv. 1987
609.5
+91.0
17.55%
1 janv. 1988
609.5
0.0
0.0%
1 janv. 1989
609.5
0.0
0.0%
1 janv. 1990
609.5
0.0
0.0%
1 janv. 1992
510.0
-99.5
-16.32%
1 janv. 1993
510.0
0.0
0.0%
1 janv. 1994
600.0
+90.0
17.65%
1 janv. 1995
706.0
+106.0
17.67%
1 janv. 1996
609.0
-97.0
-13.74%
1 janv. 2001
900.0
+291.0
47.78%
1 janv. 2002
900.0
0.0
0.0%
1 janv. 2003
1.026 milles
+126.0
14.0%
1 janv. 2005
795.0
-231.0
-22.51%
1 janv. 2006
795.0
0.0
0.0%
1 janv. 2007
795.0
0.0
0.0%
1 janv. 2008
795.0
0.0
0.0%
1 janv. 2009
795.0
0.0
0.0%
Classement des pays selon les statistiques actuelles par années

Commentaires:

Envoyer
PremiumAbout & FeedbackUn accordConfidentialité
logo
© 2022 Selected Technologies LLC – Morgan Hill, California