33
/fr/
AIzaSyAYiBZKx7MnpbEhh9jyipgxe19OcubqV5w
August 1, 2025
151933
Hong Kong SAR, China
HKG
true
2
1
Personal remittances, received (current US$)
2016,2015,2014,2013,2012,2011,2010,2009,2008,2007,2006,2005,2004,2003,2002,2001,2000,1999
Download
Bibliothèque de statistiques globales →Hong Kong SAR, China →

Personal remittances, received (current US$)

Cette statistique dans les autres pays:

AfghanistanAlbaniaAlgeriaAngolaAntigua and BarbudaArab WorldArgentinaArmeniaArubaAustraliaAustriaAzerbaijanBangladeshBarbadosBelarusBelgiumBelizeBeninBermudaBhutanBoliviaBosnia and HerzegovinaBotswanaBrazilBulgariaBurkina FasoBurundiCabo VerdeCambodiaCameroonCanadaCaribbean small statesCentral African RepublicCentral Europe and the BalticsChadChileChinaColombiaComorosCongo, Dem. Rep.Congo, Rep.Costa RicaCote d'IvoireCroatiaCuracaoCyprusCzech RepublicDenmarkDjiboutiDominicaDominican RepublicEarly-demographic dividendEast Asia & PacificEast Asia & Pacific (excluding high income)East Asia & Pacific (IDA & IBRD countries)EcuadorEgypt, Arab Rep.El SalvadorEquatorial GuineaEritreaEstoniaEthiopiaEuro areaEurope & Central AsiaEurope & Central Asia (excluding high income)Europe & Central Asia (IDA & IBRD countries)European UnionFaroe IslandsFijiFinlandFragile and conflict affected situationsFranceFrench PolynesiaGabonGambia, TheGeorgiaGermanyGhanaGreeceGrenadaGuatemalaGuineaGuinea-BissauGuyanaHaitiHeavily indebted poor countries (HIPC)High incomeHondurasHong Kong SAR, ChinaHungaryIBRD onlyIcelandIDA & IBRD totalIDA blendIDA onlyIDA totalIndiaIndonesiaIran, Islamic Rep.IraqIrelandIsraelItalyJamaicaJapanJordanKazakhstanKenyaKiribatiKorea, Rep.KosovoKuwaitKyrgyz RepublicLao PDRLate-demographic dividendLatin America & Caribbean Latin America & Caribbean (excluding high income)Latin America & the Caribbean (IDA & IBRD countries)LatviaLeast developed countries: UN classificationLebanonLesothoLiberiaLibyaLithuaniaLow & middle incomeLow incomeLower middle incomeLuxembourgMacao SAR, ChinaMacedonia, FYRMadagascarMalawiMalaysiaMaldivesMaliMaltaMarshall IslandsMauritaniaMauritiusMexicoMicronesia, Fed. Sts.Middle East & North AfricaMiddle East & North Africa (excluding high income)Middle East & North Africa (IDA & IBRD countries)Middle incomeMoldovaMongoliaMontenegroMoroccoMozambiqueMyanmarNamibiaNepalNetherlandsNew CaledoniaNew ZealandNicaraguaNigerNigeriaNorth AmericaNorwayOECD membersOmanOther small statesPacific island small statesPakistanPalauPanamaPapua New GuineaParaguayPeruPhilippinesPolandPortugalPost-demographic dividendPre-demographic dividendQatarRomaniaRussian FederationRwandaSamoaSao Tome and PrincipeSaudi ArabiaSenegalSerbiaSeychellesSierra LeoneSint Maarten (Dutch part)Slovak RepublicSloveniaSmall statesSolomon IslandsSomaliaSouth AfricaSouth AsiaSouth Asia (IDA & IBRD)South SudanSpainSri LankaSt. Kitts and NevisSt. LuciaSt. Vincent and the GrenadinesSub-Saharan Africa Sub-Saharan Africa (excluding high income)Sub-Saharan Africa (IDA & IBRD countries)SudanSurinameSwazilandSwedenSwitzerlandSyrian Arab RepublicTajikistanTanzaniaThailandTimor-LesteTogoTongaTrinidad and TobagoTunisiaTurkeyTurkmenistanTuvaluUgandaUkraineUnited KingdomUnited StatesUpper middle incomeUruguayUzbekistanVanuatuVenezuela, RBVietnamWest Bank and GazaWorldYemen, Rep.ZambiaZimbabwe

La ligne de temps

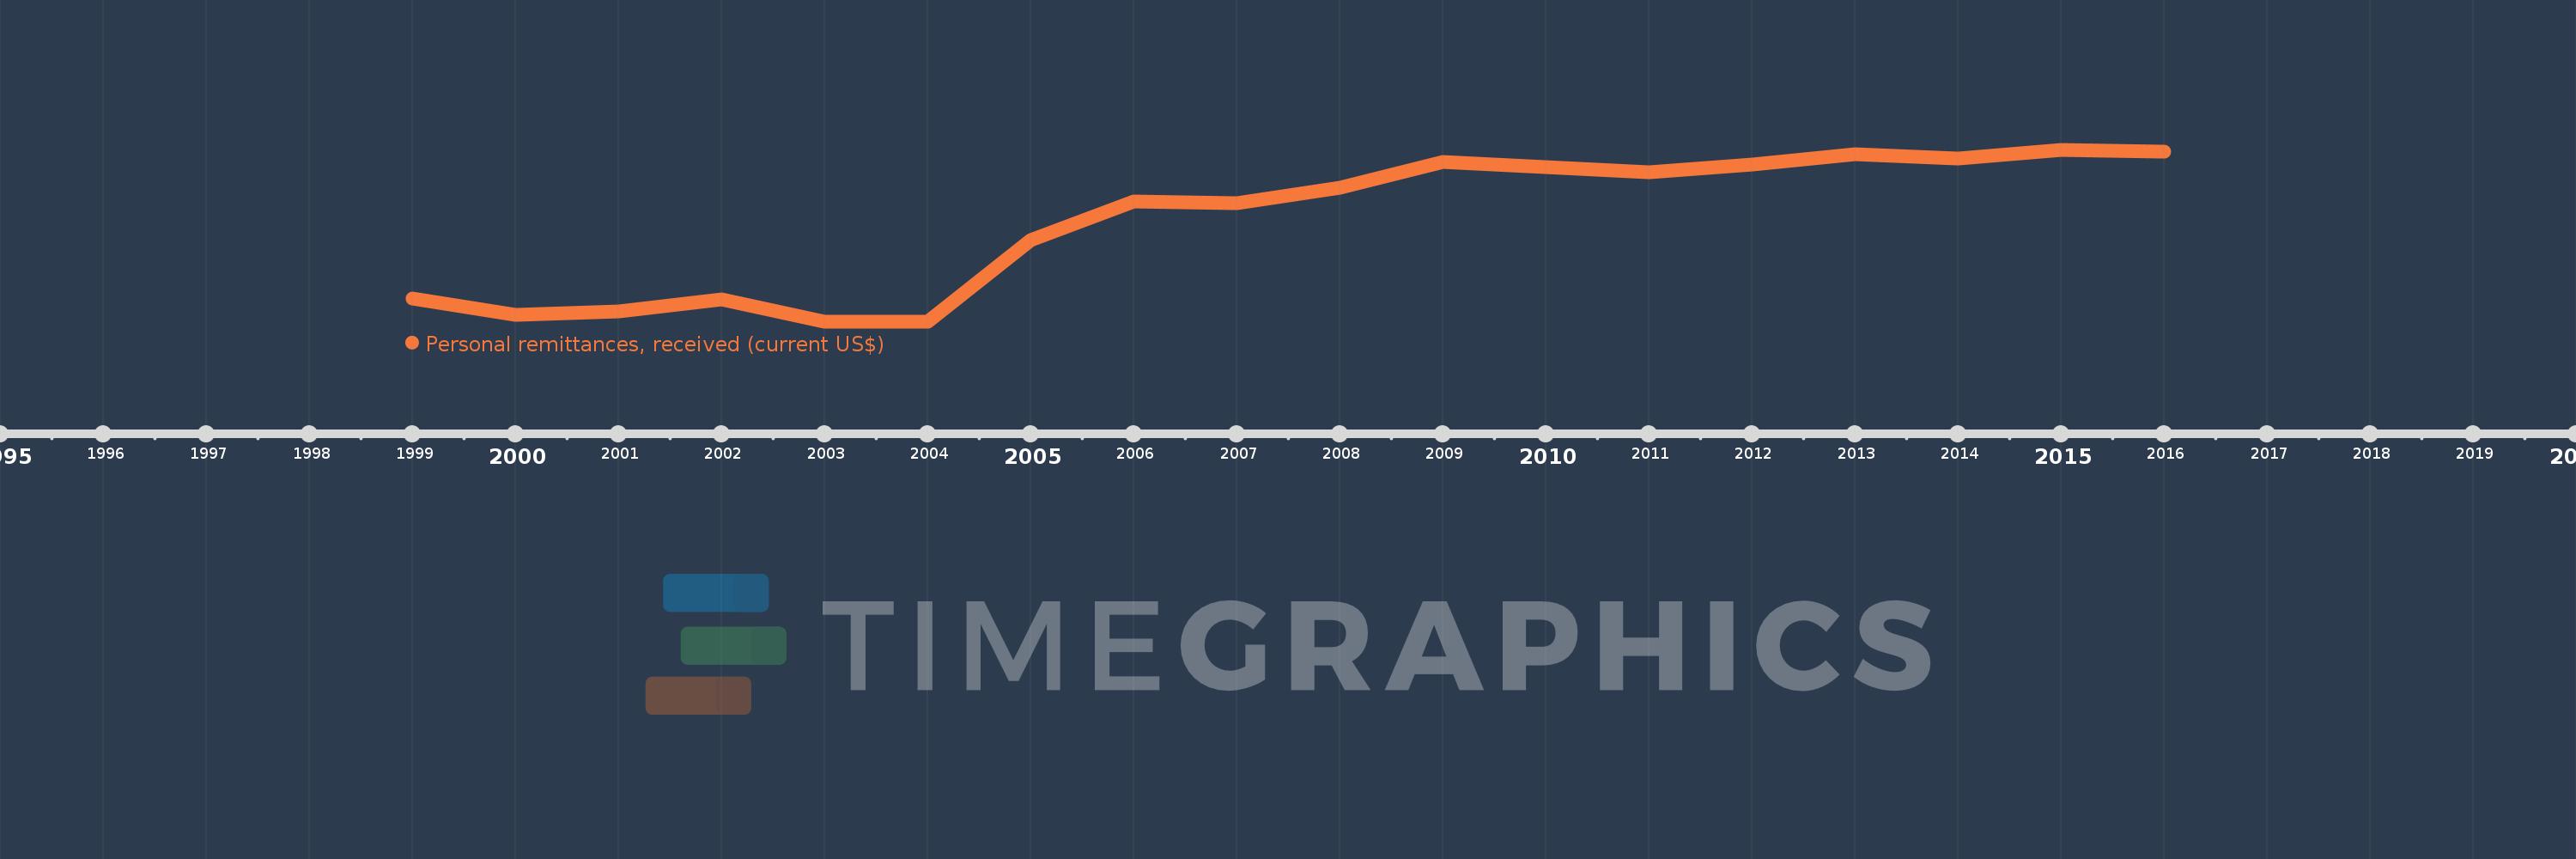
Cette échelle de temps montre un graphique de 1999 année à 2016 année Hong Kong SAR, China. Les données jusqu'à 1998 année ne sont pas présentés. Quantité d'observations actuelles selon dates: 18.

Source (désignation):

Les indicateurs du développement mondiale

Source (organisation):

World Bank staff estimates based on IMF balance of payments data.

Catégories:

Economy & Growth, Financial Sector, External Debt

Dernière mise à jour

23 avr. 2017

Les indicateurs de changement de valeurs selon les années

En moyenne:
268.003 mln.
Minimum:
119.691 mln.
1 janv. 2004
Maximum:
372.449 mln.
1 janv. 2015
Pour la date d''observation
Valeur
Changement absolu
Le changement par rapport à la valeur précédente
1 janv. 1999
153.641 mln.
+153.641 mln.
0.0%
1 janv. 2000
130.455 mln.
-23.186 mln.
-15.09%
1 janv. 2001
135.538 mln.
+5.084 mln.
3.9%
1 janv. 2002
152.845 mln.
+17.307 mln.
12.77%
1 janv. 2003
120.53 mln.
-32.315 mln.
-21.14%
1 janv. 2004
119.691 mln.
-838.443 milles
-0.7%
1 janv. 2005
239.857 mln.
+120.165 mln.
100.4%
1 janv. 2006
296.761 mln.
+56.905 mln.
23.72%
1 janv. 2007
294.034 mln.
-2.728 mln.
-0.92%
1 janv. 2008
316.867 mln.
+22.833 mln.
7.77%
1 janv. 2009
355.347 mln.
+38.481 mln.
12.14%
1 janv. 2010
347.792 mln.
-7.555 mln.
-2.13%
1 janv. 2011
339.569 mln.
-8.223 mln.
-2.36%
1 janv. 2012
351.639 mln.
+12.069 mln.
3.55%
1 janv. 2013
366.815 mln.
+15.177 mln.
4.32%
1 janv. 2014
360.238 mln.
-6.578 mln.
-1.79%
1 janv. 2015
372.449 mln.
+12.212 mln.
3.39%
1 janv. 2016
369.981 mln.
-2.468 mln.
-0.66%

Classement des pays selon les statistiques actuelles par années