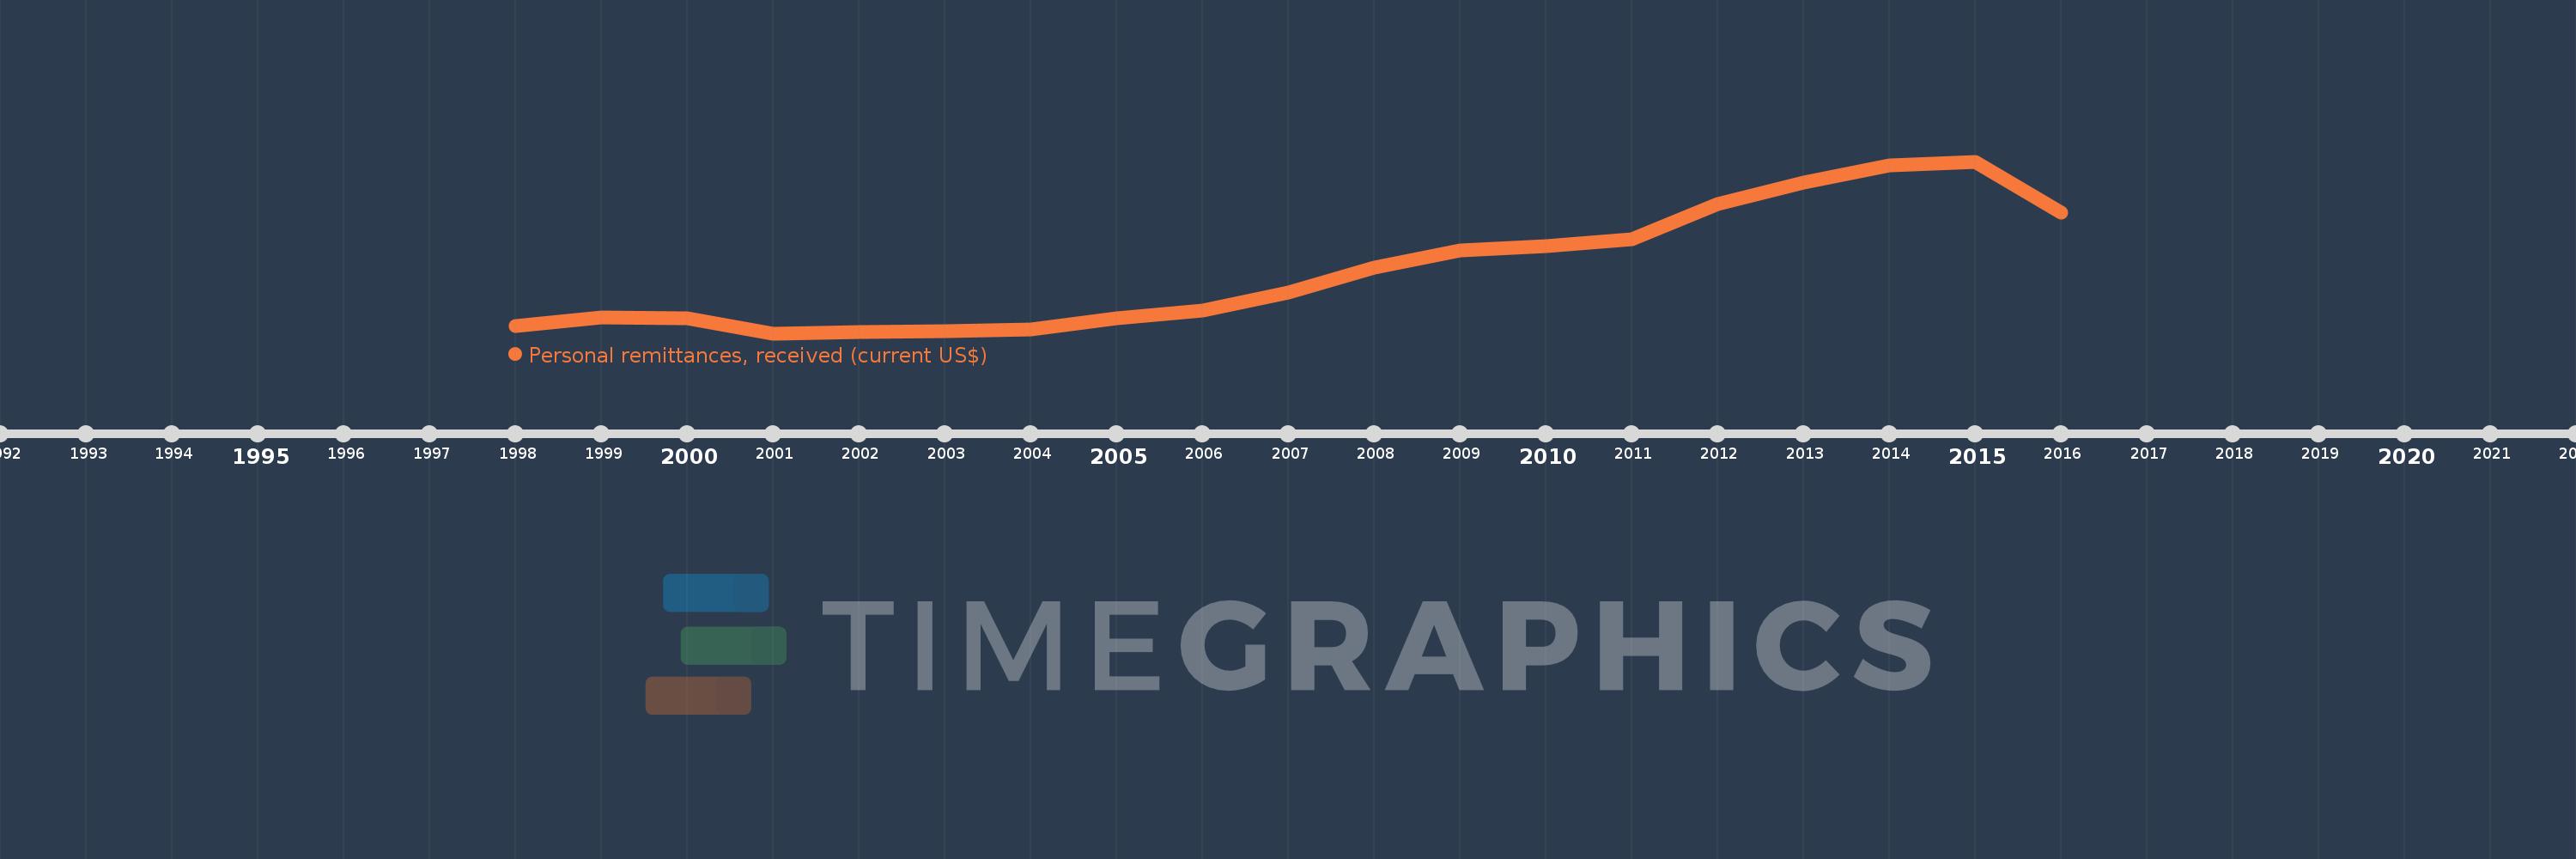
Cette échelle de temps montre un graphique de 1998 année à 2016 année Georgia. Les données jusqu'à 1997 année ne sont pas présentés. Quantité d'observations actuelles selon dates: 19.
Source (désignation):
Les indicateurs du développement mondiale
Source (organisation):
World Bank staff estimates based on IMF balance of payments data.
Catégories:
Economy & Growth, Financial Sector, External Debt
Dernière mise à jour
23 avr. 2017
Les indicateurs de changement de valeurs selon les années
En moyenne:
857.923 mln.
Minimum:
205.93 mln.
1 janv. 2001
Maximum:
1.986 mds
1 janv. 2015
Pour la date d''observation
Valeur
Changement absolu
Le changement par rapport à la valeur précédente
1 janv. 1998
284.0 mln.
+284.0 mln.
0.0%
1 janv. 1999
372.9 mln.
+88.9 mln.
31.3%
1 janv. 2000
360.8 mln.
-12.1 mln.
-3.24%
1 janv. 2001
205.93 mln.
-154.87 mln.
-42.92%
1 janv. 2002
218.639 mln.
+12.709 mln.
6.17%
1 janv. 2003
226.329 mln.
+7.69 mln.
3.52%
1 janv. 2004
248.454 mln.
+22.125 mln.
9.78%
1 janv. 2005
358.59 mln.
+110.136 mln.
44.33%
1 janv. 2006
446.005 mln.
+87.415 mln.
24.38%
1 janv. 2007
627.349 mln.
+181.343 mln.
40.66%
1 janv. 2008
883.065 mln.
+255.717 mln.
40.76%
1 janv. 2009
1.065 mds
+181.956 mln.
20.61%
1 janv. 2010
1.112 mds
+46.598 mln.
4.38%
1 janv. 2011
1.184 mds
+72.316 mln.
6.51%
1 janv. 2012
1.547 mds
+363.339 mln.
30.69%
1 janv. 2013
1.77 mds
+222.841 mln.
14.4%
1 janv. 2014
1.945 mds
+175.17 mln.
9.9%
1 janv. 2015
1.986 mds
+41.19 mln.
2.12%
1 janv. 2016
1.459 mds
-527.734 mln.
-26.57%
Classement des pays selon les statistiques actuelles par années